. . . and a dictionary to understand what’s being asked of them. 
2 Likes
So 2.5v wouldn’t cut it.
Does that mean with a reference that is ± 0.041v and a 16:1 voltage divider we are asking too much to get a voltage reading better than ±0.7v - I didn’t take that class on circuit analysis - mesh analysis on a bank of solar collectors nearly put me in the school’s funny farm.
2 Likes
Going back and looking at that article, the reference to the 2v reference and the divider network appear to be two different things - I suspect that the microcontroller contains an A/D with a built-in 2v (±) reference.
Looking at the schematic, I note that there is a separate 5v input on pin 4 through an 820Ω resistor and a 0.1μF decoupling capacitor that’s not a power feed, and the VCC reference goes through the resistor network Matt mentioned, (and another 0.1μF decoupling capacitor), to pin 11. My bet is that these two pins are the pins where they measure the Vbatt and V+5 voltages.
I’ve downloaded the datasheet and I’m going to take a look at it.
I just don’t understand why raising the +5v rail causes the A/D for the battery voltage to go nuts. And we’ve seen this before when a Raspberry Pi adapter is plugged into a Raspberry Pi 3 on the 'bot, the apparent Vbatt voltage goes above 14v.
I suspect that folks like Matt are long gone - and more’s the pity - we’ll have to reverse engineer the firmware and schematic logic to make any sense out of any of this stuff.
2 Likes
My script warned at just under 10 volts and formally shut down at 9.69 volts.
I followed your lead and my script is set to trigger a shutdown at <= 9.75 and warn at <= 10.00 - and I followed your script’s lead by requiring four successive warns or shutdowns before performing the action.
I numbered the three batteries, and I am going to plot the curve of each of them individually.
The first of the three started at 2:56pm Moscow time, (it is now 8:41pm), and we are at 10.24 v indicated on the meter.
The robot is just sitting there, wasting electricity, , and we’ll see what happens. Actually, I should probably modify it to provide “calibrated” at-the-terminal battery voltage readings as the uncorrected readings are less useful. (IMHO).
@cyclicalobsessive,
It turns out I already have a copy of “Carl” - apparently I cloned your repository at some point in time in the past and now I’ve brought it down to Charlie so he can have fun with some of the interesting things you’ve done.
2 Likes
This was Dave’s till shutdown test (LIDAR powered but not spinning, USB speaker, camera, IR sensor):
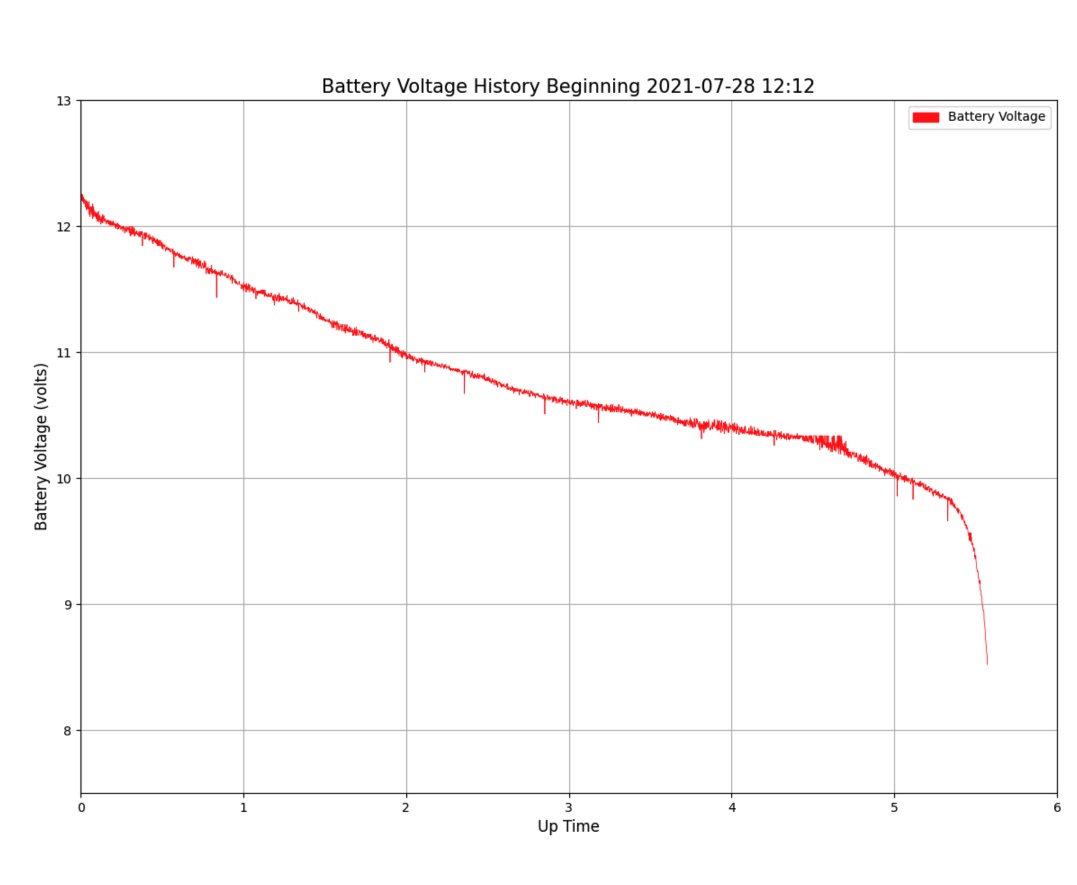
- The 10v gives about 20 minutes warning before the 9.75v safety shutdown
- The 9.75v shutdown occurs about 15 minutes before the sudden loss of power around 8.15v
REV_PROTECT_DIODE = 0.81    # The GoPiGo3 has a reverse polarity protection diode drop of 0.6v to 0.8v (n=2)
WARNING_LOW_vBatt = 10.0       # Give Advance Warning battery is around "the knee" (~20 minutes to safety shutdown vBatt )
SAFETY_SHUTDOWN_vBatt = 9.75   # Battery Discharge Protection Circuit allows down to 8.15v (~15 minutes reserve at 9.75v)
IGNORE_TOO_LOW = True          # Set False to test shutdown at SAFETY_SHUTDOWN_vBatt instead of running till battery fully discharged
2 Likes
From README.md:
It should be noted that, at least on the Raspbian-derived installations, if you want to install for Python3, you need pip3, not pip.
After installing with pip3, I was able to get past the “matplotlib module not found” errors, but now I get this:
pi@raspberrypi:~/Desktop/LogValueAndPlot $ python3 ./plotBattV.py  battV/csv/battV-20220316-1456-1.csv
Input File:        battV/csv/battV-20220316-1456-1.csv
Traceback (most recent call last):
  File "./plotBattV.py", line 38, in <module>
    dtObj = datetime.datetime.strptime(file_date, '%Y%m%d-%H%M')
  File "/usr/lib/python3.7/_strptime.py", line 577, in _strptime_datetime
    tt, fraction, gmtoff_fraction = _strptime(data_string, format)
  File "/usr/lib/python3.7/_strptime.py", line 362, in _strptime
    data_string[found.end():])
ValueError: unconverted data remains: -1
pi@raspberrypi:~/Desktop/LogValueAndPlot $ python3 ./plotBattV.py  ./battV/csv/battV-20220316-1456-1.csv
Input File:        ./battV/csv/battV-20220316-1456-1.csv
Traceback (most recent call last):
  File "./plotBattV.py", line 38, in <module>
    dtObj = datetime.datetime.strptime(file_date, '%Y%m%d-%H%M')
  File "/usr/lib/python3.7/_strptime.py", line 577, in _strptime_datetime
    tt, fraction, gmtoff_fraction = _strptime(data_string, format)
  File "/usr/lib/python3.7/_strptime.py", line 362, in _strptime
    data_string[found.end():])
ValueError: unconverted data remains: -1
pi@raspberrypi:~/Desktop/LogValueAndPlot $
What did I do wrong?
This is the file I was trying to plot. . .
battV-20220316-1456-1.csv.txt (107.2 KB)
(the “-1” indicates that this is the first of the three batteries)
Update:
The original file had a bunch of NULL bytes at the end. I removed them and tried again and got the same error.
2 Likes
So line 38 is trying to get the date from the file name and it doesn’t expect that extra “-1” in the file name.
# reads data file passed as parameter e.g. ./plotBattV.py battV/csv/battV-YYYYmmdd.csv
#         note datafile must be named exactly that format
...

file_date = inFile[-17:inFile.find(".csv")]
dtObj = datetime.datetime.strptime(file_date, '%Y%m%d-%H%M')
The easiest fix is probably to make some folders batt1, batt2, batt3 and change the file name back to the expected.
* If desire output in a specific place, set base_dir variable: ./ is the default
Yes, that is what happens when the power is yanked. Removing them is needed.
I also spied a more recent version of the battery logging toolset, but I don’t think the plot program changed. It seems like I added some options to the vBatt logging program when I started working with Dave and the Li-Ion Battery:
2 Likes
OK, I’m in.
I ran two graphs and they run from 0:00 to 23:59 even though the data on one graph is a narrow band down the middle and the other crossed midnight, so half the data is missing.
Two questions:
- Is it possible to scale the graph so that it fits the data like many of the pictures you show?
- Do you know how to capture a specific folder, (and subfolders) from GitHub instead of having to clone the entire repository to get what I want? (i.e. the …/systests/battery folder and subfolders?)
1 Like
Did you use plotBattV.py or plotBattLife.py? Did you try the other one?
- plotBattV.py: Creates a graphic of voltage vs wall-clock-time in battV–.png (0:00 to 23:59)
- plotBattLife.py: Creates a graphic of voltage vs up time in battLife–.png (0 to max hours)
No I don’t, so what I end up doing is make the desired folder on the RPi, in a browser clicking on each github file I want, clicking the RAW button, copying the URL, then in a shell type
wget [paste URL here]
to bring the files down one at a time. I usually chmod 777 *.py at the end.
2 Likes
It appears I was using the “wrong” plotting script.
Here are the three batteries - all of which should have been started from fresh.
Note: Battery numbers are arbitrary and mean nothing other than a way to distinguish one battery from another.
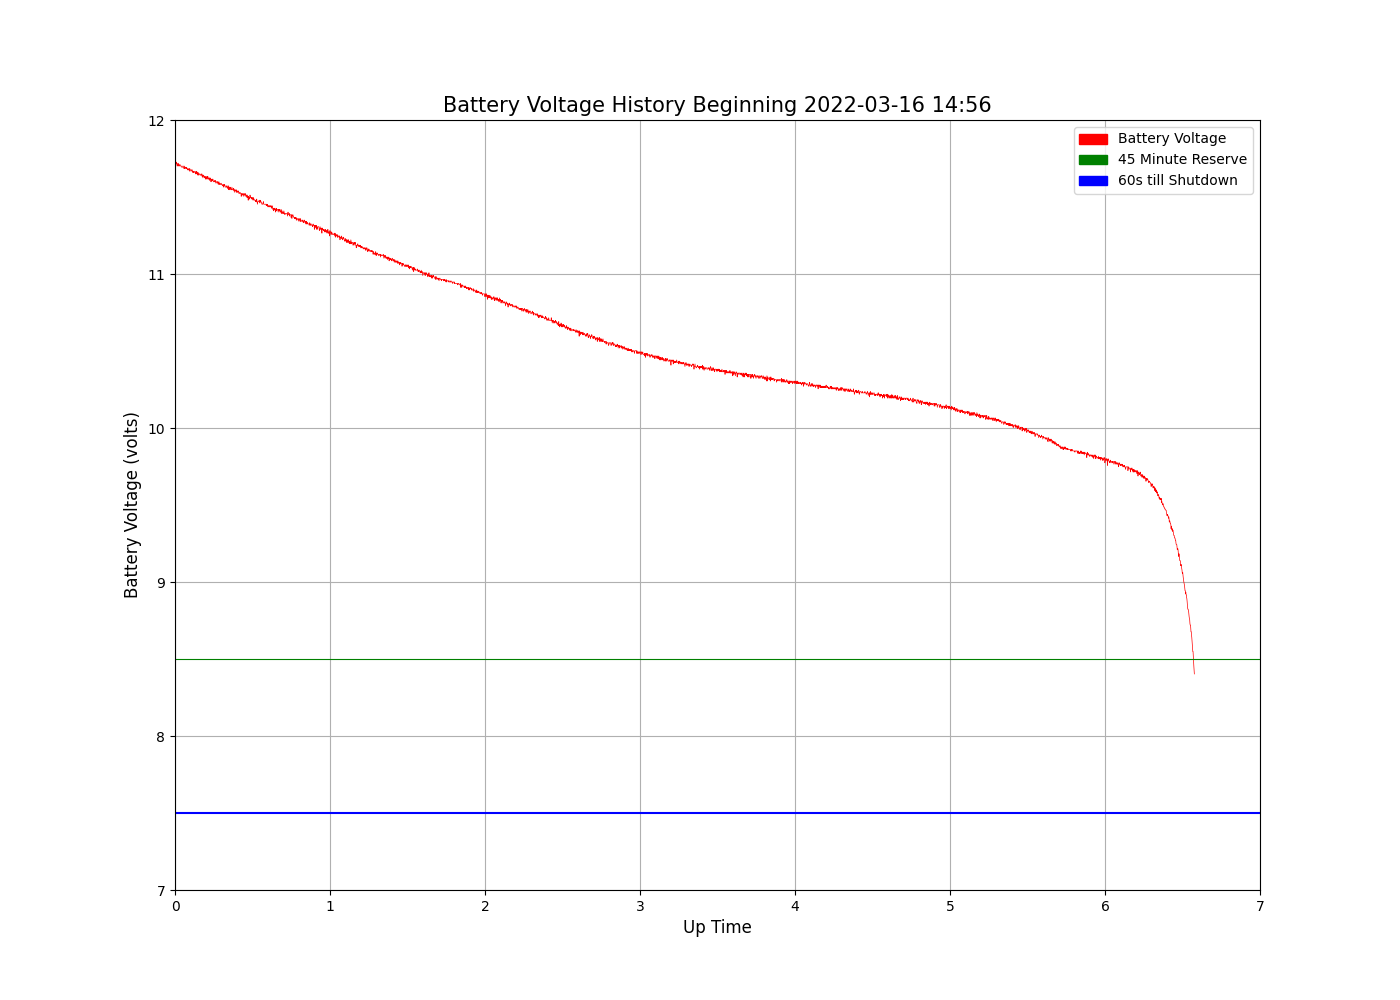
Battery 1:
Input File:  battV/csv/battV-20220316-1456.csv
First datetime: 2022-03-16 14:56:32  [11.693 volts]
Last datetime: 2022-03-16 21:31:07  [8.403 volts]
Total Life: 6.58 hours
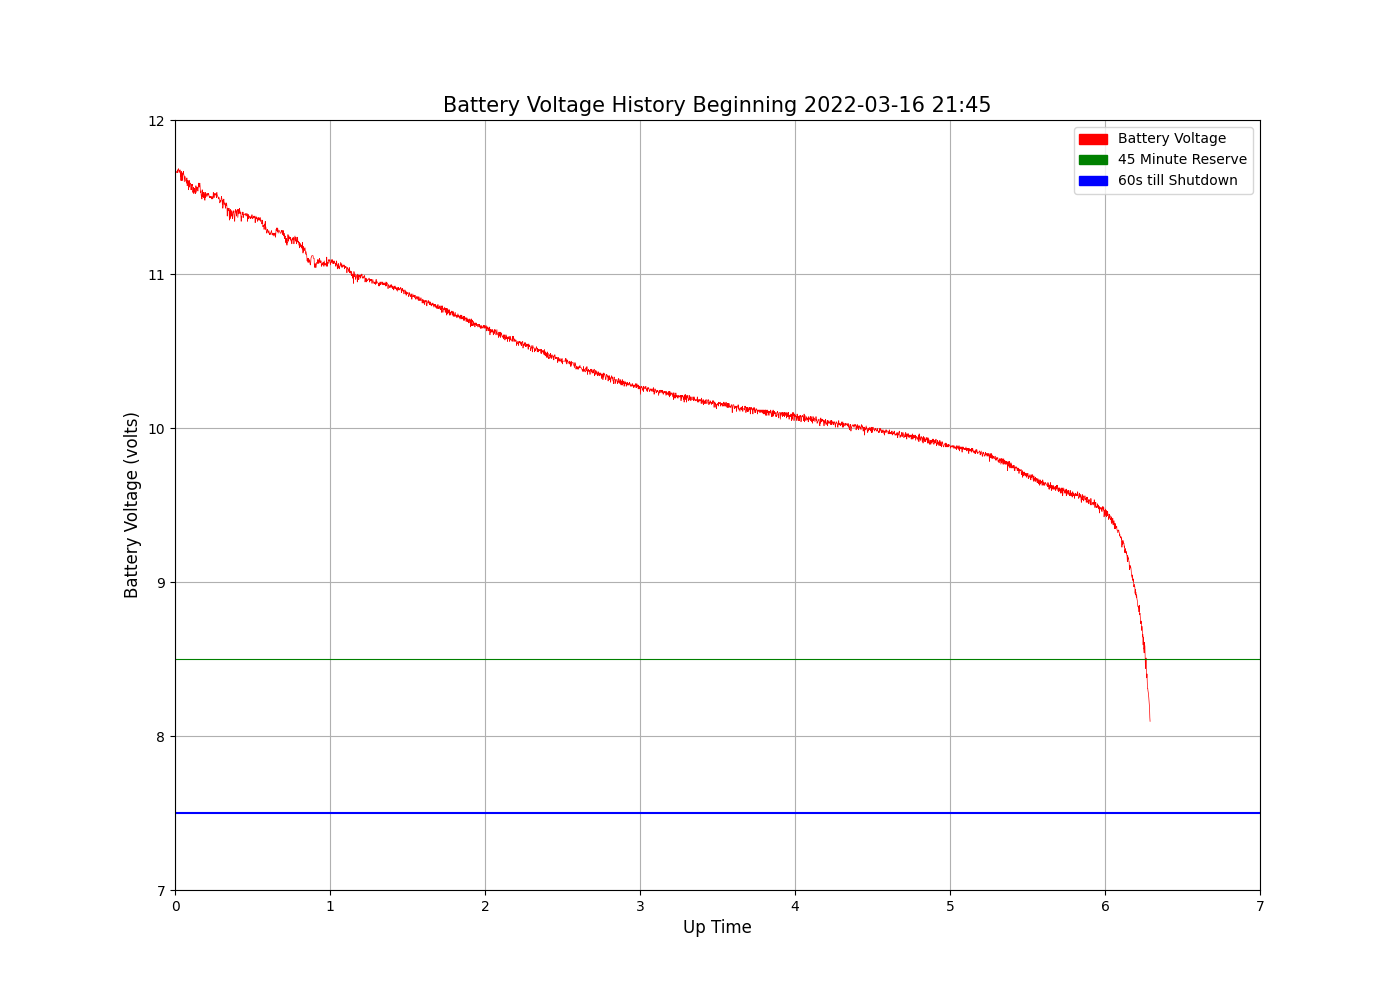
Battery 2:
Input File:  battV/csv/battV-20220316-2145.csv
First datetime: 2022-03-16 21:45:22  [11.659 volts]
Last datetime: 2022-03-17 04:02:49  [8.095 volts]
Total Life: 6.29 hours
Battery 3:
Input File:  battV/csv/battV-20220317-1115.csv
First datetime: 2022-03-17 11:15:01  [11.976 volts]
Last datetime: 2022-03-17 18:24:37  [7.966 volts]
Total Life: 7.16 hours
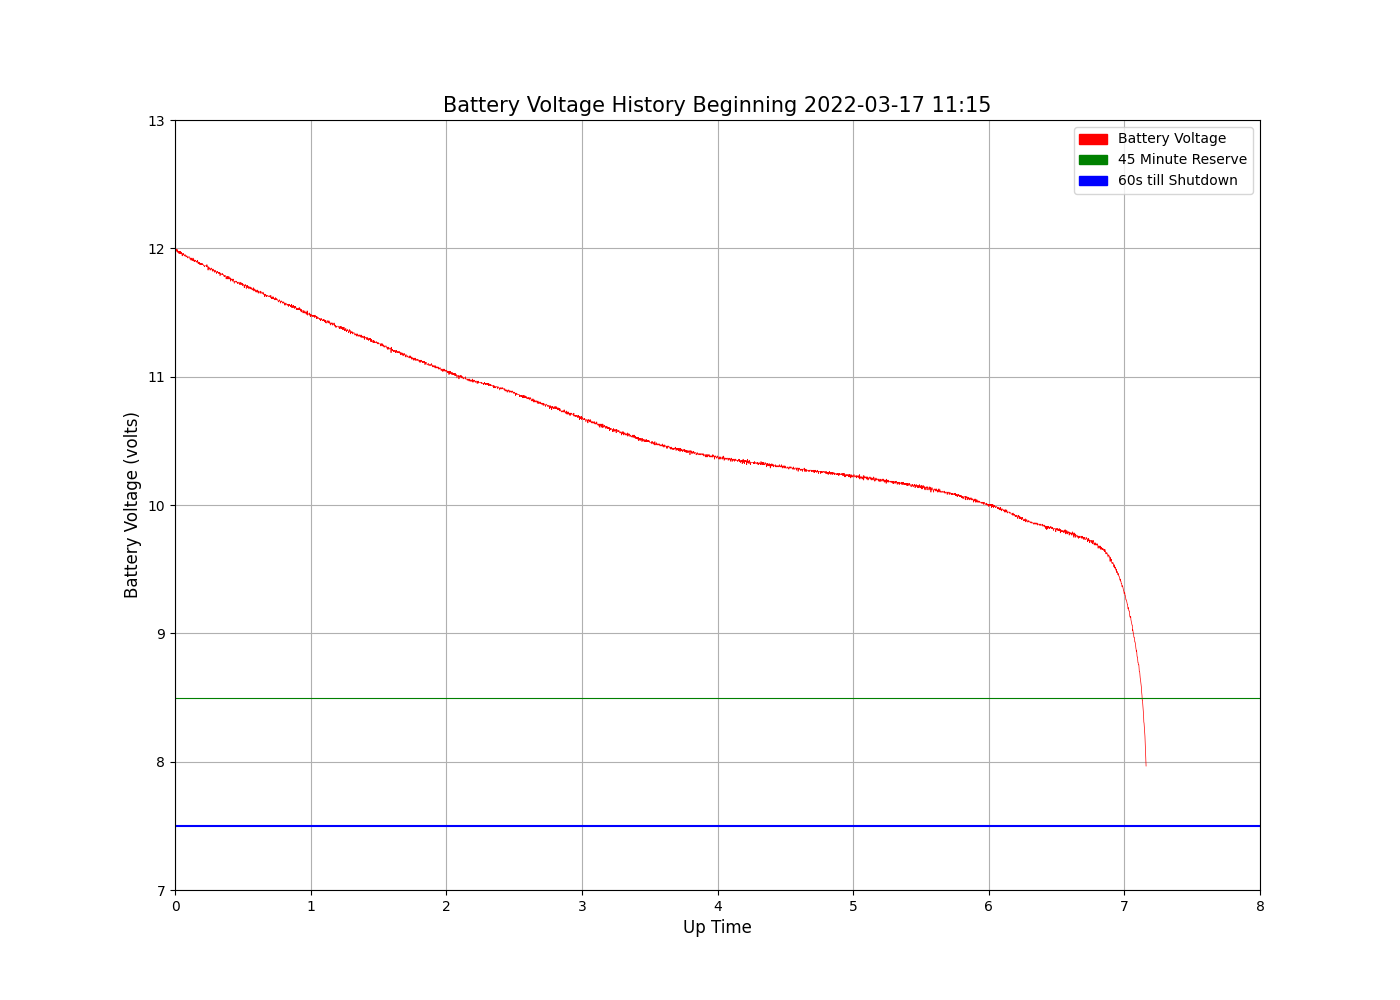
The variation in battery lifetime is something like 52 minutes from shortest to longest - though I think that might be caused by the second battery test being run while I was installing and removing plotting dependencies two or three times to get it right.
In any event, I will want to re-run these tests using freshly changed batteries and nothing else happening to see if that difference is real.
The only thing I wish was that the battery voltage and time scales had minor graduations and some minor graduation graticule lines to help interpret the data without a compass and straightedge. I looked at the plotting code, (quickly, I was with the granddaughters all day today), and didn’t see anything that jumped out at me as far as what defined the graduations.
Thanks!
2 Likes