GoPiGo Onboard Display Test - Progress is being made!

I have been working on attaching a small display to my two robots so that they can report important information while they’re running.  Sort of like @cyclicalobsessive’s talking robots where they speak important information - I want mine to display it on an on-board display.

The challenge is:

  • What’s the best O/S to continue my development work on?  Buster?  Bullseye?  Bookworm?

  • What’s the best display to use?

    • The Waveshare e-Paper displays have a (relatively) easy interface and consume minimal amounts of power, but they use the SPI buss and I’ve been having conflicts with that causing the robot to go brain-dead.  They’re also incredibly slow to update so they’d be useless for dynamically changing data.
    • I have two Adafruit displays that use i2c, so there’s no conflict, but they’re active displays so they consume more power and the API is more difficult to use.  Because they’'re LED-type displays, updates are blazingly fast, but the power consumption is a factor.

Additionally, there’s the question of what operating system the various libraries support.  As I have discovered while trying to install the GoPiGo libraries, things don’t always fit the way you would expect them to fit - especially with bookworm, it being the Windows-11 of Raspberry Pi software as there’s such a large paradigm shift, seemingly breaking everything.

====================

Today I completed the preliminary setup for the display testing.

  1. I created a 6 operating system multi-boot environment with a “Project_Files” partition common to all of them mounted on /home/pi/Project_Files, selectable with a 5-position dip-switch
    In order they are, (from 0 to 5.  “0” is no dip switch selected and 1 - 5 are individually selected dip-switch positions):

    • Buster downloaded from Raspberry Pi.
    • GoPiGo O/S configured for the Waveshare e-Paper display.
    • GoPiGo O/S configured for the Adafruit 16x2 LED display with buttons.
    • GoPiGo O/S configured for the Adafruit 128x32 OLED display.
    • Bullseye 32 bit downloaded from Raspberry Pi.
    • Bookworm 64 bit downloaded from Raspberry Pi.
  2. Buster, Bullseye, and Bookworm have the GoPiGo libraries installed, including the graphical libraries, (wxPython, which was a pain), and they’re working.

  3. All are configured to use the attached Adafruit real-time clock, an attached +5 power boost circuit, and a DC voltmeter that can be switched to monitor either the +12v or +5v rails.

  4. All are configured to mount a shared “Project Files” partition for shared/common data.

What with everything going on here, this has been going on for about a month or so, a little bit at a time as I encountered problems, found solutions, and implemented them.

Today it is complete.  I FINALLY have all the test environments set so that they’re ready to test.

All I need to do now is figure out a way to backup everything so that I can restore stuff if things go all pear-shaped.  I’m thinking of creating a series of 14 compressed rsync images of the 14 partitions on the 500 gig SSD.

  • There are six operating systems.

  • Each operating system has two dedicated partitions, one for the boot partition and the second for it’s companion root partition.  Therefore all of the six bootable operating systems occupy 12 partitions.

    • Previous multi-boot experiments demonstrated that each operating system had, (and needed), a unique and individual boot partition - they could not share one - so I had to duplicate this in my multi-boot environment.  Ergo, the need for twelve partitions.
       
  • There is a large “Project Files” partition at the very end of the drive.  (Partition 13)

  • And finally, as the first partition on the drive, there is a special “OS_BOOT” partition that reads the dip-switch and decides which of the six operating systems to transfer the boot process to.  (Partition 14 - actually partition 1, but who’s counting?)

I should be able to create a rsync image of each of the partition’s contents and I will need to include a text file containing a description of the partition structure and metadata.

Next Steps:

  1. Back everything up.

    • Where?  I’ll have to find somewhere to put all this data.
  2. Begin testing the various displays and their configurations.

  3. Figure out how to gather the data to be displayed, extract what’s important, and format it for the display being used.

Extra Credit:

  1. Determine if it’s possible to automatically detect the display being used and switch to the correct drivers and modules.
1 Like

Like WOW! - That is cool.

  • Buster - I sort of understand - that is the “official” non-GoPiGo OS alternative
  • Bookworm - I sort of understand - that is the “official” Raspberry Pi OS
  • Bullseye? From my readme “Not Recommended, but if you must”

The GoPiGo3 is a surviving dinosaur. Visit it in the Buster Zoo, or chase it down in the Bookworm wilderness.

1 Like

wxPython was a royal pain.  Each installation target needed a different set of prerequisites, and nobody tells you which you need until you try it and it splatters itself over half the known universe.  In my case, I probably installed more than I needed - annoying!

Not to mention that after you get all the prerequisites installed and actually start creating the wheel, you then go do your exercises, bike in the 90° heat, visit the squirrels, and do some bird-watching while you wait for it to complete.

And THEN, when you try to run something like the control panel, you discover that the graphical API’s have changed and you throw more exceptions than. . . . Well, I’ll leave that up to your imagination!

1 Like

I’m going to try all of them as much as it’s available to do so - with the GoPiGo O/S being the primary target.  I included the others so that after I get things the way I like 'em running on the GoPiGo O/S, I can try exporting it to the other operating systems, just in case.  And!  There’s still the Jetson Nano to convert!  Challenges abound!

So are birds and reptiles for that matter, but they’re still a thing, 'eh?  :wink:

1 Like

Update:

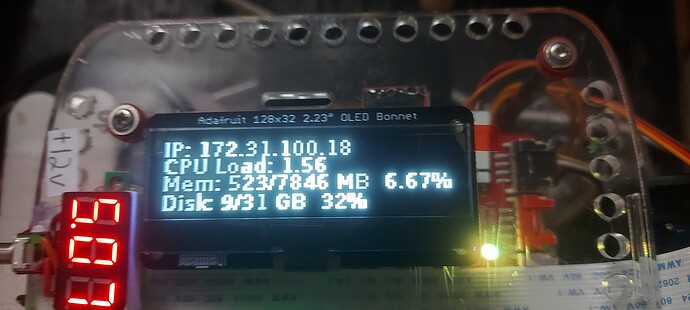
The Adafruit 128x32 OLED display appears to both work and not crash the robot.


This is the Adafruit “Stats.py” test script.

Using both the servos and the test script at the same time causes the test script to pause a bit.

1 Like

Congrats!

Now how is your “CPU Load: 1.56”? Do you have a crypto miner running in the background?

1 Like

I don’t even know what that figure represents or its unit of measurement.  I had assumed that it was a percentage of total processor use.  (i.e. 1.56%)

What can you tell me about that number?

The script I used.

stats.py (2.9 KB)

cmd = "top -bn1 | grep load | awk '{printf \"CPU Load: %.2f\", $(NF-2)}'"

Runs “top” in batch mode with one iteration, sending the result to grep which pulls out the line containing “load”, and processes that line with awk, which pulls out the 1 minute load average and calls that “CPU Load”.

Officially the “load average” is the number of processes in queue to be run, which just doesn’t speak to me at all.

Now my definition: The average number of CPU cores actually processing code - (and does not include any i/o activity).

I am not going to claim this is a valid definition - it is my definition that helps me evaluate what is going on inside that bugger.

My definition is also a bit cloudy until we think about the number “1.56” on your display and your CPU that has 4 cores.

An average load of “1.56” in my definition says computing is using an average of 1.56 cores of the four available cores - thus dividing the value by 4 yields the actual Raspberry Pi 4’s four core “Average CPU Load”. So 1.56 / 4 = 39% of your Raspberry Pi 4 is busy working. (Again ignoring I/O.)

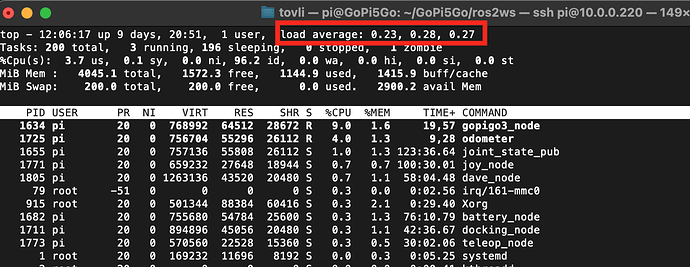
To understand why I asked why your “1.56” is so high, I offer GoPi5Go-Dave’s 15 minute average load value of 0.27 (the values are 1, 5, and 15 minute averages) which is 6.75% of his Raspberry Pi 5 CPU:

Dave at idle is:

  • reading the INA217 voltage, current, power
  • reading the GoPiGo3 Left and Right encoder and motor status values
  • converting the encoder values and the encoder value change into position and velocity estimates
  • computing battery power added or consumed since last docking change
  • estimating percent battery remaining
  • watching for a voltage or current value that requires action be initiated
  • publishing ROS 2 topics
pi@GoPi5Go:DOCKER:~/GoPi5Go/ros2ws $ ros2 topic list
/battery_state
/battery_voltage
/cmd_vel
/dock_status
/joint_states
/joy
/led/blinker/left
/led/blinker/right
/led/eye/left
/led/eye/right
/led/wifi
/motor/dps/both
/motor/dps/left
/motor/dps/right
/motor/encoder/left
/motor/encoder/right
/motor/position/both
/motor/position/left
/motor/position/right
/motor/pwm/both
/motor/pwm/left
/motor/pwm/right
/motor/status
/odom
/parameter_events
/robot_description
/rosout
/servo/position/S1
/servo/position/S2
/servo/pulse_width/S1
/servo/pulse_width/S2
/tf
/tf_static

  • the subscription call back for many of those published topics are being activated
  • AND the top program which is collecting the stats

All that is only loading Dave at 7%, while your program is using 39% of your Pi. So I asked “Do you have a crypto miner running in the background?”

p.s. My definition is only valid for an average load less than the number of cores - after that it doesn’t matter because your computer will never listen to you or talk to you again.

p.s.s. Today’s crypto miners are too smart to let you see them running. They shut down when you log in, so “just jokin’”.

ps.ps. The stats.py app loops 10 times per second. It would be interesting to see what the CPU Load value is if you change the sleep to 1 second:

time.sleep(1)   # was (0.1)
1 Like

It is possible that prior attempts were still running in the background.

I will have to try it next week as we’re visiting Uzbekistan right now.

I will look at the “stats” program and compare it to top/htop.

P.S.
How do you do the screenshot? The Pi O/S doesn’t include a screenshot utility.

P.p.s.

Maybe it’s the active RealVNC connection running that’s cranking it up?

1 Like

It is from the remote shell running on my Mac. I do not use (Tiger)VNC for a Remote Desktop into my Raspberry Pi computers very much.

1 Like

I did some searching on the whole “load factor” thing, got lots of noise but few real answers, so I asked on the Raspberry Pi portion of Stack Exchange.

https://raspberrypi.stackexchange.com/questions/149183/what-does-the-raspberry-pi-cpu-load-average-numbers-actually-mean/149186#149186

There’s a bit of attitude in the answer, but by-and-large it was useful.

The gist of what I got out of the answer is that these numbers don’t really translate well into a really useful “load average” - to me they still seem to be numbers, like BogoMIPS, that just come out of thin air.  (i.e.  According to the reply I received, a load-factor of about 1.5 is about a 37% utilization.)

How I’m supposed to see “1.5” and translate that to “a little more than 1/3 of the total capability of the system is in use right now” is a mystery to me.

1 Like

Exactly as I told you - Divide that number by 4 cores and you get 37%.

Now why is your processor loaded 37% at idle?

First run htop and order by %CPU to see who is hogging your processing.

It is likely the stats.py program running 10 times per second, so first try looping once per second and see what effect on the load you see.

I actually run my “monitor.py” programs at once per 10 seconds even.

What does your htop show is taking so much processor?

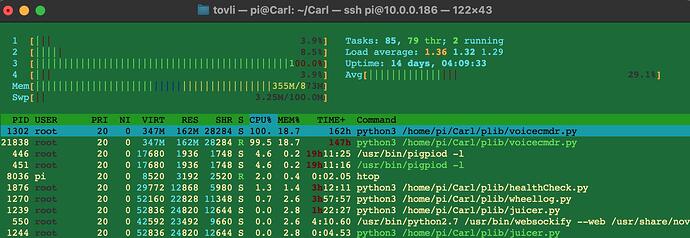
Even Carl only has a load average of 1.3 with his voice recognition listening full-time and taking one whole core:

Note that pigpiod is grabbing 5% of one core - not a big deal but at idle it is not doing anything other than listening for a GoPiGo3 program to ask it to do something.

All the other Carl processes take up about 2% of one core or half a percent of the CPU.

Your 1.56 load average is 39% of your processor - Even running ROS stuff doesn’t use that much. What is your robot thinking so hard about?

Are you using the desktop? On Carl VNC adds about 1% on one core or less than 1% of CPU, so I can’t imagine that is what is “stealing your processor resources”.

What a minute - were you spinning the servos when you took that shot?

1 Like

Update:

  1. I have reduced the update time to 1 second.

  2. I am working on preventing more than one instance from launching.

  • I am considering the possibility of a “lock” file for the utility that each time the utility is run, it would check for the lock file and - if it exists - it would immediately end itself.
  1. I am also researching ways to control how child processes handle termination signals - i.e. CTL-C, etc.  As it is currently written, the child processes can receive the termination signal before the main process causing a exception to be thrown instead of an orderly shutdown.

By increasing the sleep time and trying to reduce additional instances of the program and its children, I have significantly reduced the processor load.
 

  1. I am using the desktop.

  2. I have not determined what percentage of the processor is being used by VNC.

  3. Apparently the library processes called by the Stats script are rather “greedy” in the fact that they seem to consume a lot of processor resources, though I have no idea why.  This was demonstrated by increasing the sleep time, (i.e. reducing the amount of time spent running the Adafruit’s child processes), which significantly reduced the processor load.

1 Like

Update:

Apparently I have been barking up the wrong tree.

A more detailed examination of the problem indicates that the stats.py script may not be the root cause.

The problem appears to be centered around the Chromium browser and the complexity of the web page.

  1. When launched, with the default GoPiGo home page being shown, several dozen “chromium” processes are spawned and the load average goes from about 0.5 to about 0.9.

  2. Loading a page from Stack Exchange doesn’t affect the numbers much, however a page from the Dexter Industries forum causes a huge jump to over 1.5, eventually settling down to about 0.8 - until I start interacting with the page where it jumps to over 2.0.

  3. Once I stop typing, the numbers, (slowly!), drop to less than 1.0.

Apparently both the complexity of the page and what I am doing seem to directly influence the load numbers.

I also suspect that, because I am using a desktop session this drives the load numbers even higher.

Note that this is being done on Charlie at the present moment.  Charlie is equipped with a Pi-4, 4gb Raspberry Pi.

Typing as I am doing right now, the load numbers are approximately 2.33, once I stop and save they will drop again.

1 Like

Oh my, you are running chrome on the robot via a remote desktop session … I wouldn’t have thought of it.

My only use of a remote desktop has been to view pictures I snapped with the camera without having to transfer them to my desktop, or to view a map file generated by ROS. I never run any GUI apps. I read about people trying to use a Raspberry Pi as a desktop computer and just shake my head in disbelief.

The Raspberry Pi family is severely lacking in the GPU area. If it can be done on my desktop, that is where I do it. If it is a mobile robot necessary function, that is where it runs.

Sorry, it just never occurred to me that you might be running a browser on the robot.

Now we understand the load. Thank you for digging into it.

1 Like

You run your robots headless, right?

Do any of your robots use GoPiGo O/S?  Did you disable the desktop on it?

I want to make sure we’re comparing apples to apples, or at least fruit to fruit and not fruit to turnips.

1 Like

I am heavily invested in the desktop - it is much easier for me to use the desktop than a terminal window for much of what I do - and since a lot of what I am doing is file-based, I do a lot of my file editing on the robot itself - using the file manager, Thonny or Geany, a terminal window, etc.

I used to do a lot with a keyboard and mouse directly connected to the robot, but now I primarily use VNC as it allows me to use a full-sized keyboard instead of the dinky “Raspberry Pi” keyboard I use when I connect directly to it.

I also connect the HDMI to a (relatively) huge TV/monitor display which makes it much easier for me to see than on my (smaller) laptop screen.

Update:
I started a thread over on the Raspberry Pi forums:
https://forums.raspberrypi.com/viewtopic.php?t=378165

No, I always run a desktop OS, but rarely ever remote in. Like I said, only to view a jpg or map.pgm file. I don’t believe I have ever launched the browser on the desktop.

The non-connected desktop does not take very much resource since it is static with no one logged into it.

I’m not running GoPiGo OS, true. GoPiGo OS does have a web server running and I don’t know what the load of that pushing Bloxter to a remote browser takes - that may be significant.

Carl runs Raspbian For Robots and does have a web server for his “personal statistics site” that sits idle most of the time, and once every 10 seconds it briefly takes 57% of one core, which averages out to nearly nothing.

In Carl’s case, the “voicecmdr” is taking one whole core 100% of the time listening for “Hey Carl”.

The pigpiod which I don’t think Carl uses or needs, but is given to us in an enema bag by DI, takes up about 10% of one core - so roughly 2-3% of the processor. No biggie, but wasted battery load in Carl.

All the other programs that are “Carl”, take up about 0.25 load or 6-10% of Carl’s Pi3B (not even a 3B+ for him).

I knew you were not running speech reco on your bot, so seeing an average load above 1.0 just seemed way strange to me.

1 Like

According to the folks over at the Raspberry Pi forums, load factors of between 1 and 2 - perhaps even higher - are normal when the Raspberry Pi is being used as a “desktop system”.  (i.e.  Being used with a desktop, browser, etc. etc. etc.)

This is, (supposedly), true because modern browsers like Chromium and Firefox implement half the known universe so that they can do anything and everything within the browser window - like rendering PDF’s, playing YouTube videos, singing and dancing bears, ponies riding bicycles, acrobats being chased by lions with whips, etc.

Another possibility is the fact that there is nothing that keeps multiple instances of the status display from running - and if I accidentally stack multiple instances up on each other, the load, memory, and swap usage goes right to hell in a hand-basket.

I am going to try to work on preventing multiple instances from running.  I also made a small sub-piece of the script that only clears and resets the screen and I am going to include a “remove the lock file” part to it just in case things get stuck.

Side note:

I am typing this on my Windows 10 laptop with the robot running.  The VNC connection is connected, but the screen has timed out and the monitor is showing “no signal”.  The load factor was showing around 1.5 or so, but has - slowly - dropped to 0.33, 0.69, 0.54, 0.50, etc.

Restarting the screen by placing the mouse within it and moving it, caused the load factor to jump to about 0.70 and it’s now falling back to 0.32 with the VNC connection and the status script running.

Opening the browser with several windows running ramped the load factor up to nearly 3.  Once I closed the Dexter Industries and Raspberry Pi Forums windows, it dropped to about 1.5.  Moving to the GoPiGo web page and selecting “drive”, the load factor doesn’t change that much, (± 0.3), and activating the blinkers or eyes doesn’t do much either.

However, running the robot’s wheels does cause a marked increase in the load factor, by as much as 0.5 - 0.7, running the load factor into the low two’s.  (Right now, with nothing happening, but with the screen active and the GoPiGo web page open, the load factor varies between about 1.3 to 1.8 with a median value of about 1.5.)  It would be interesting to graph the instantaneous load factor over time, but I don’t know if it would show anything other than a profile of the Rocky Mountains.

Another test:  With the “Drive” page open, I tried moving my hand in front of the camera which causes a changing video display on the web page.  Result:  No discernible difference in the load factor.

P.S.
It’s interesting to note that of all the web pages I open, (I haven’t tried YouTube yet), the Dexter Industries Forum web page is one of the pages that places the heaviest load on the system.  Other pages like Adafruit, Stack Exchange, the Raspberry Pi forums, (etc.), are not nearly as stressful.

1 Like

That is what I expected to hear. Glad you solved the mystery- it was the “money grabbing” browser, not “crypto money browsers”

1 Like