One of the first things folks with ROS robots will “show off” is an occupancy grid or LIDAR map of the room. Since Carl doesn’t have LIDAR and doesn’t run ROS, I thought occupancy grids to be in the “too hard” or at the very least “not yet” category.
That was until robotshop tweeted the work of BigFace83 and his Big-Wheel-Bot project.
He implemented a sensor data recording program that stores [left and right encoders, imu heading, forward and rear facing ultrasonic sensors, and a pair of +/- 45 degree off heading IR sensor readings five times a second to a Data.txt file, and captures a synchronized MotionJPEG at FPS 320x240 into an avi container video that can be viewed by VLC on the Raspberry Pi desktop, (and also can be read in later and annotated with objects, ranges, headings, etc).
So basically four programs
- Remote Control Driving
- Data Gatherer - Python, OpenCV output Data.txt and <datetime>.avi
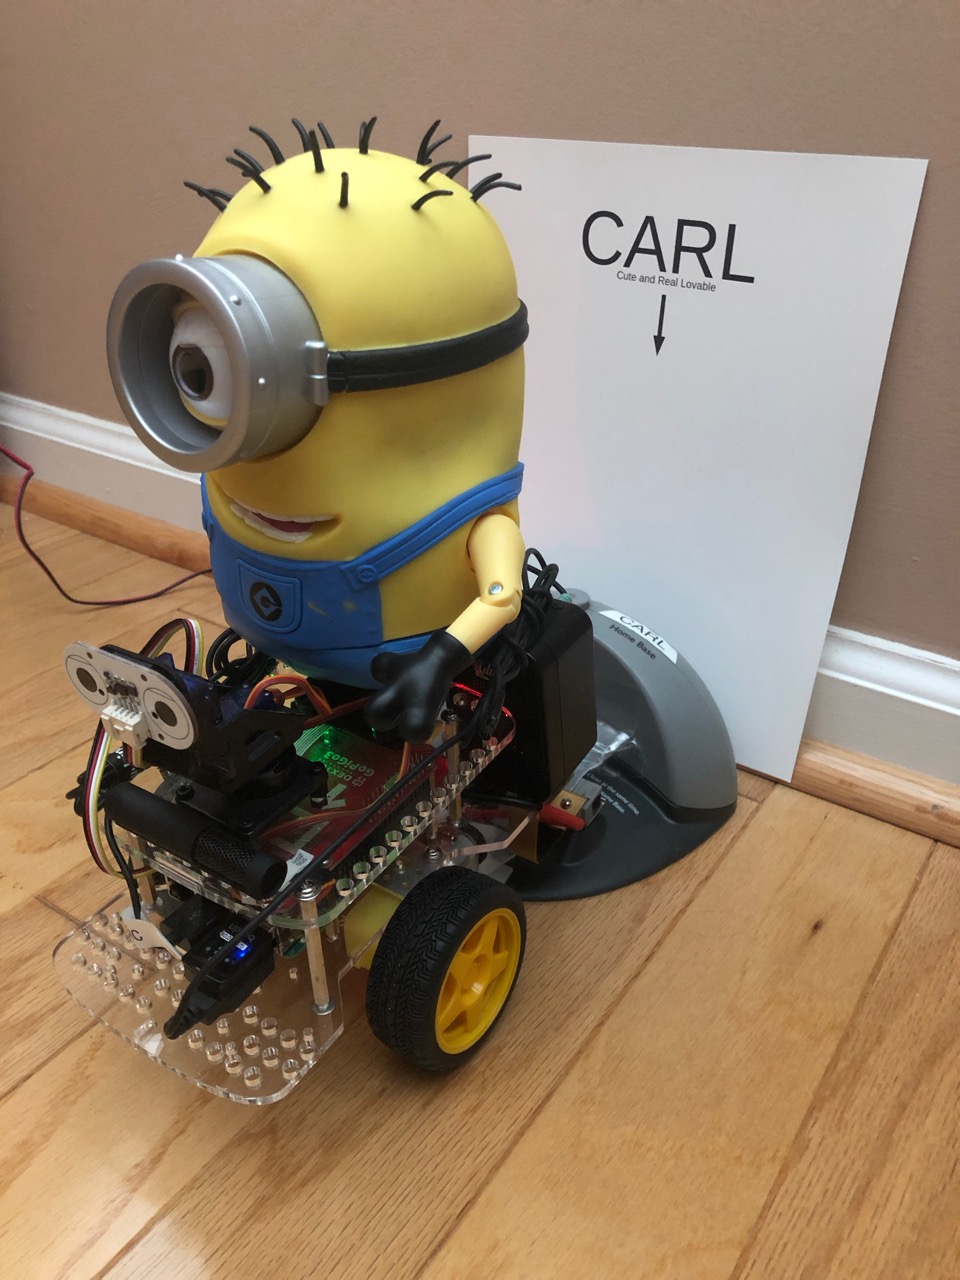
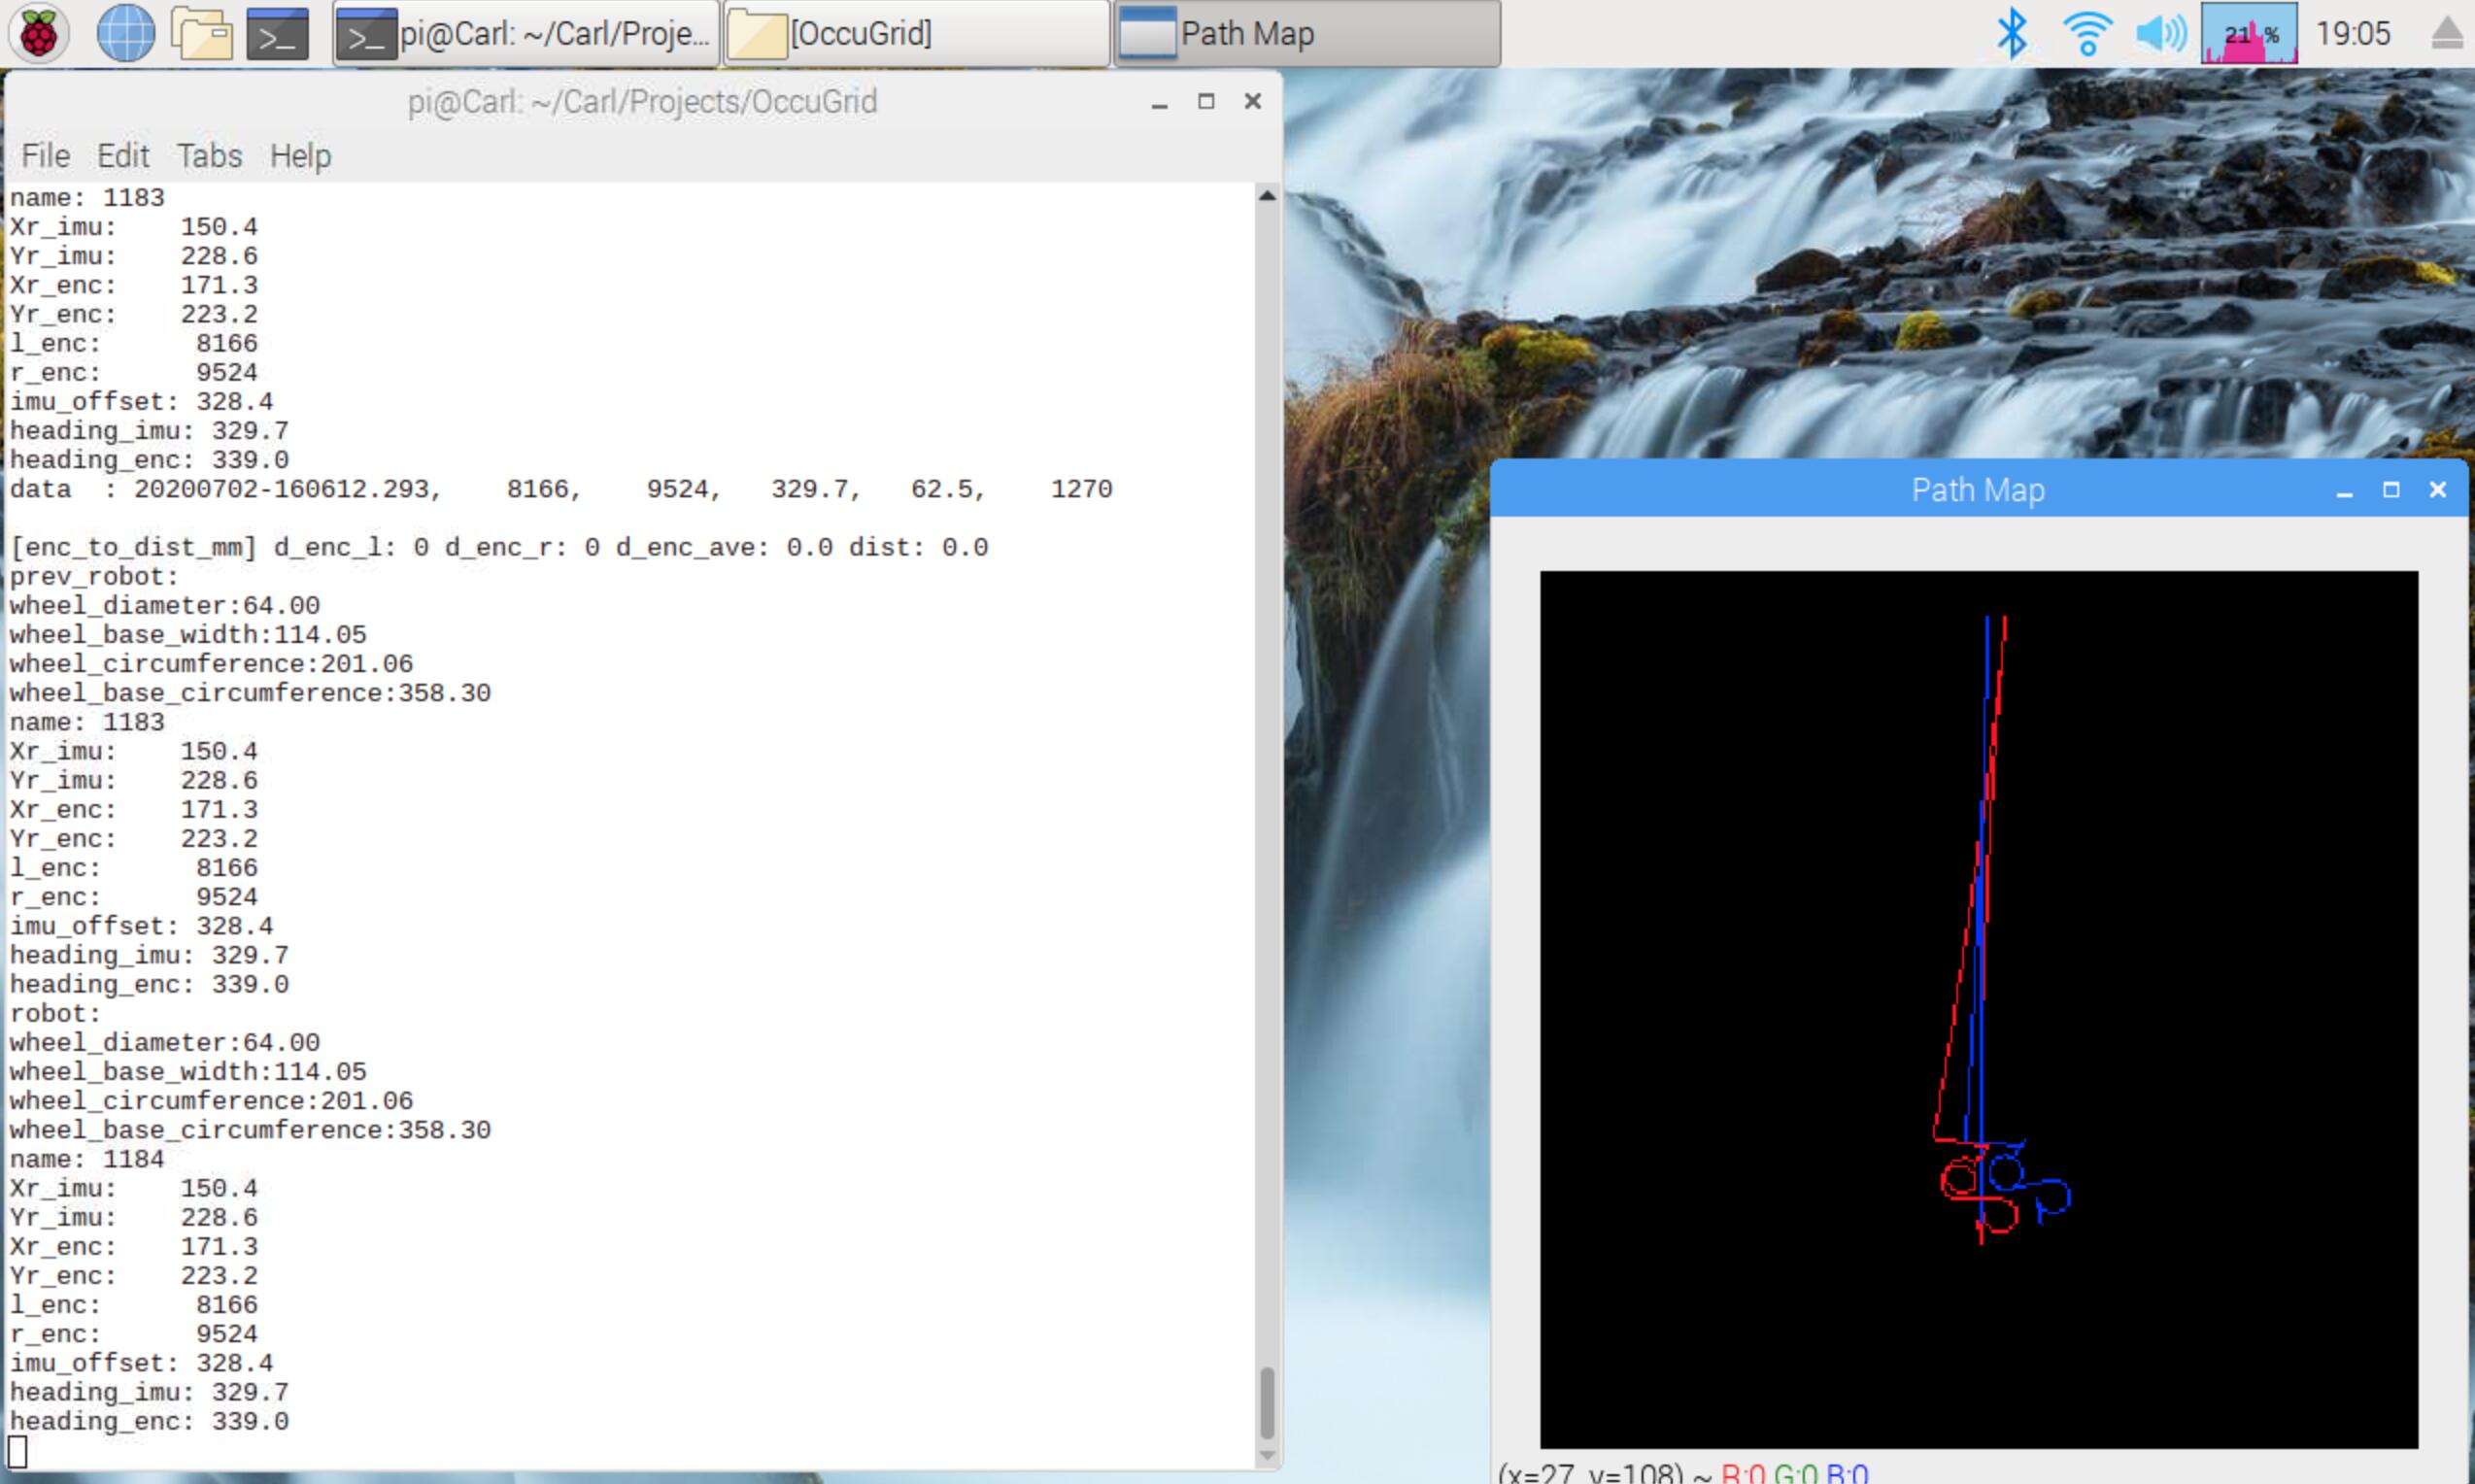
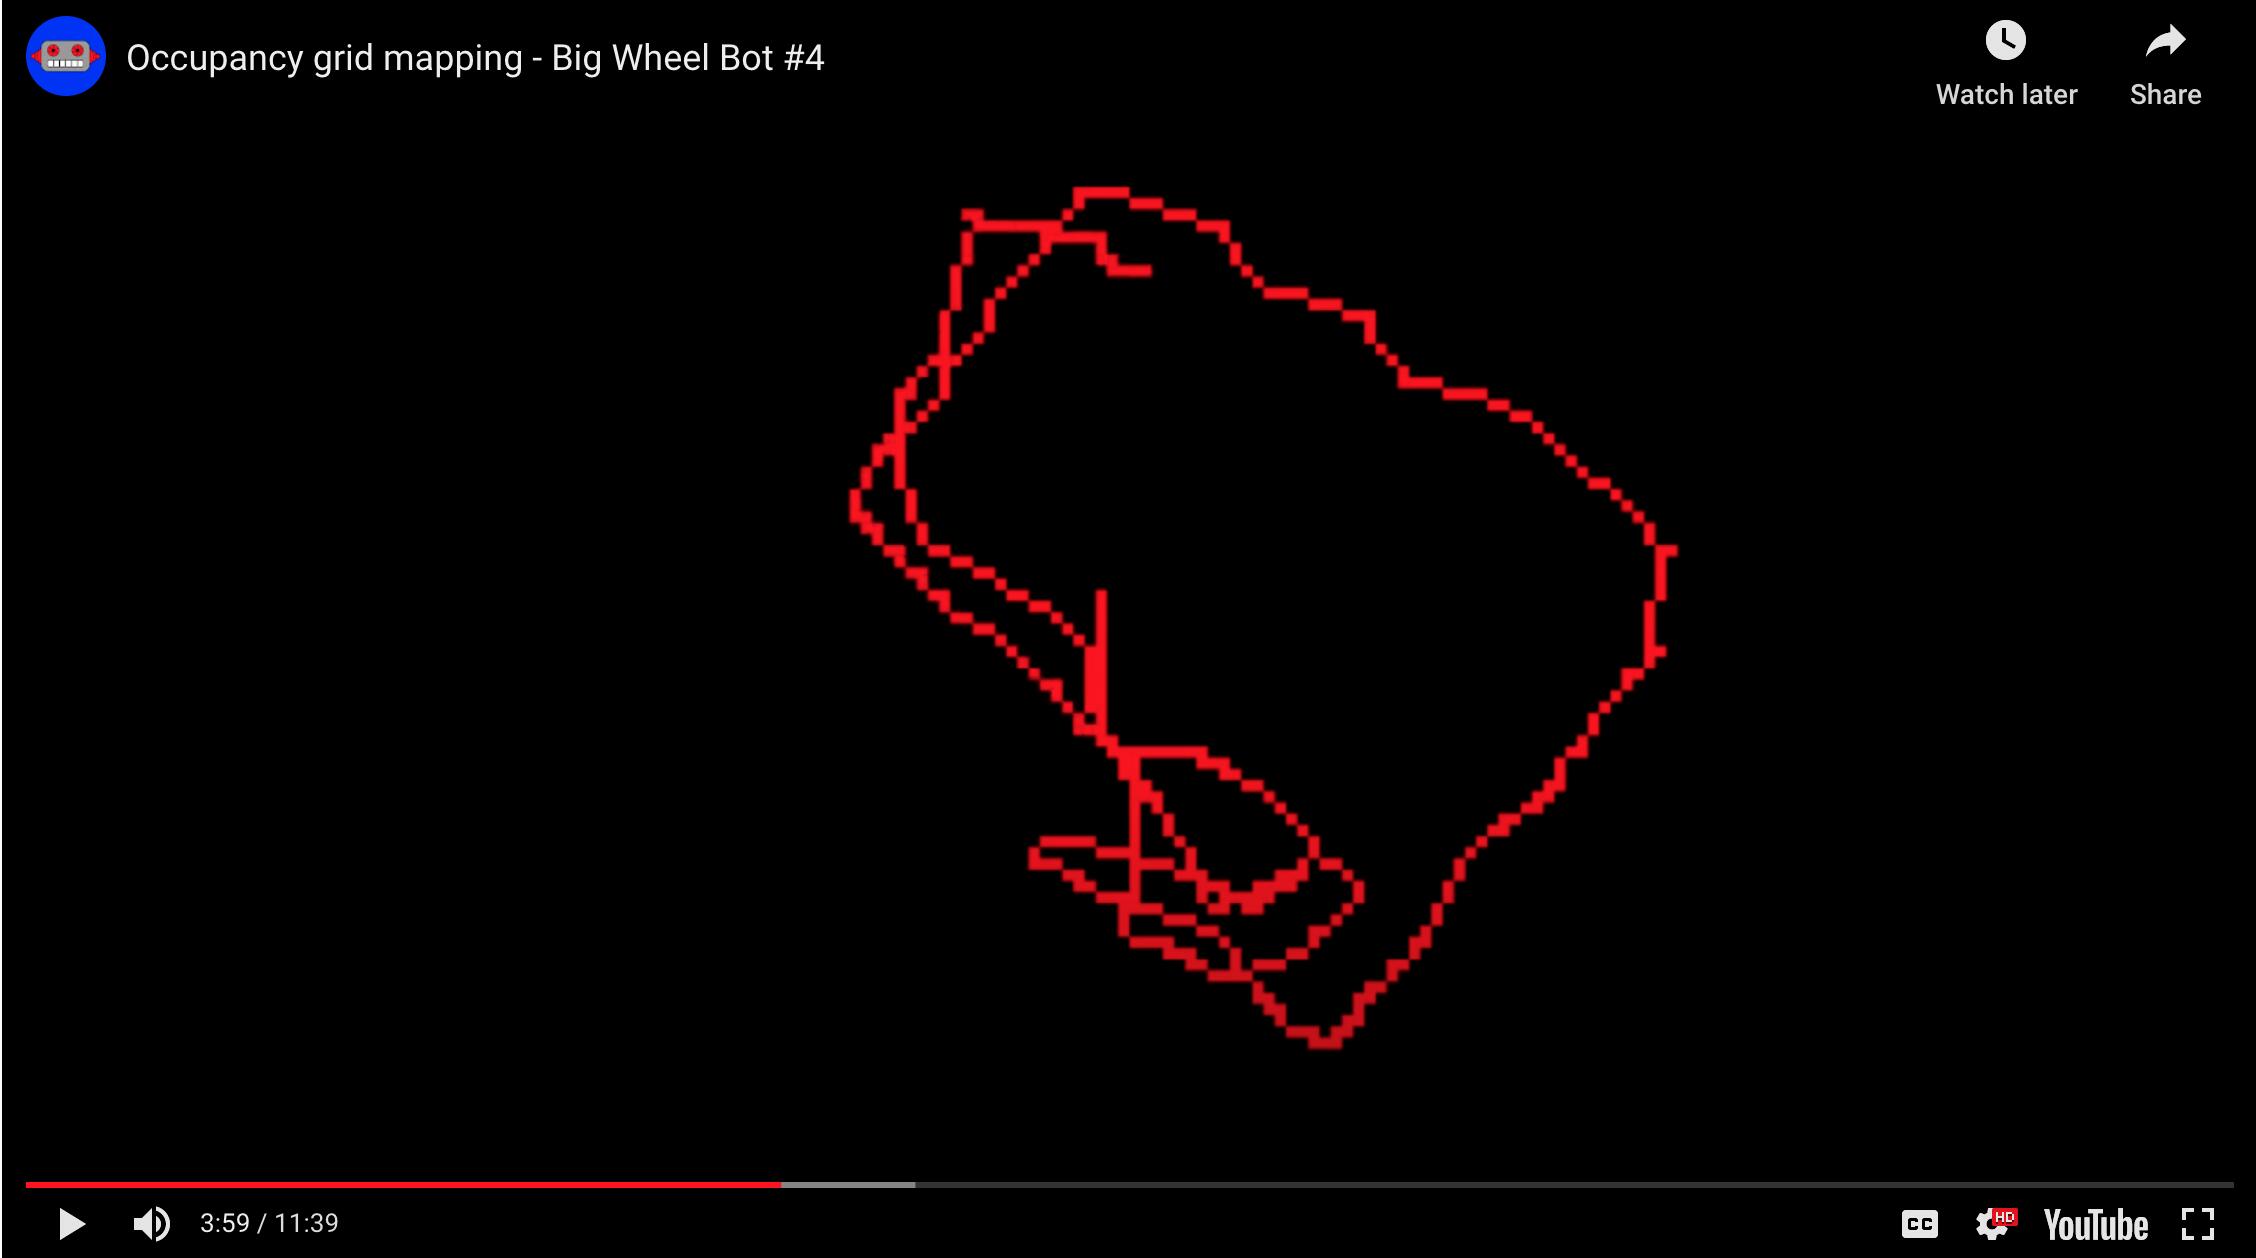
- Path Plotter - Python, OpenCV reads Data.txt and plots path from encoders and imu
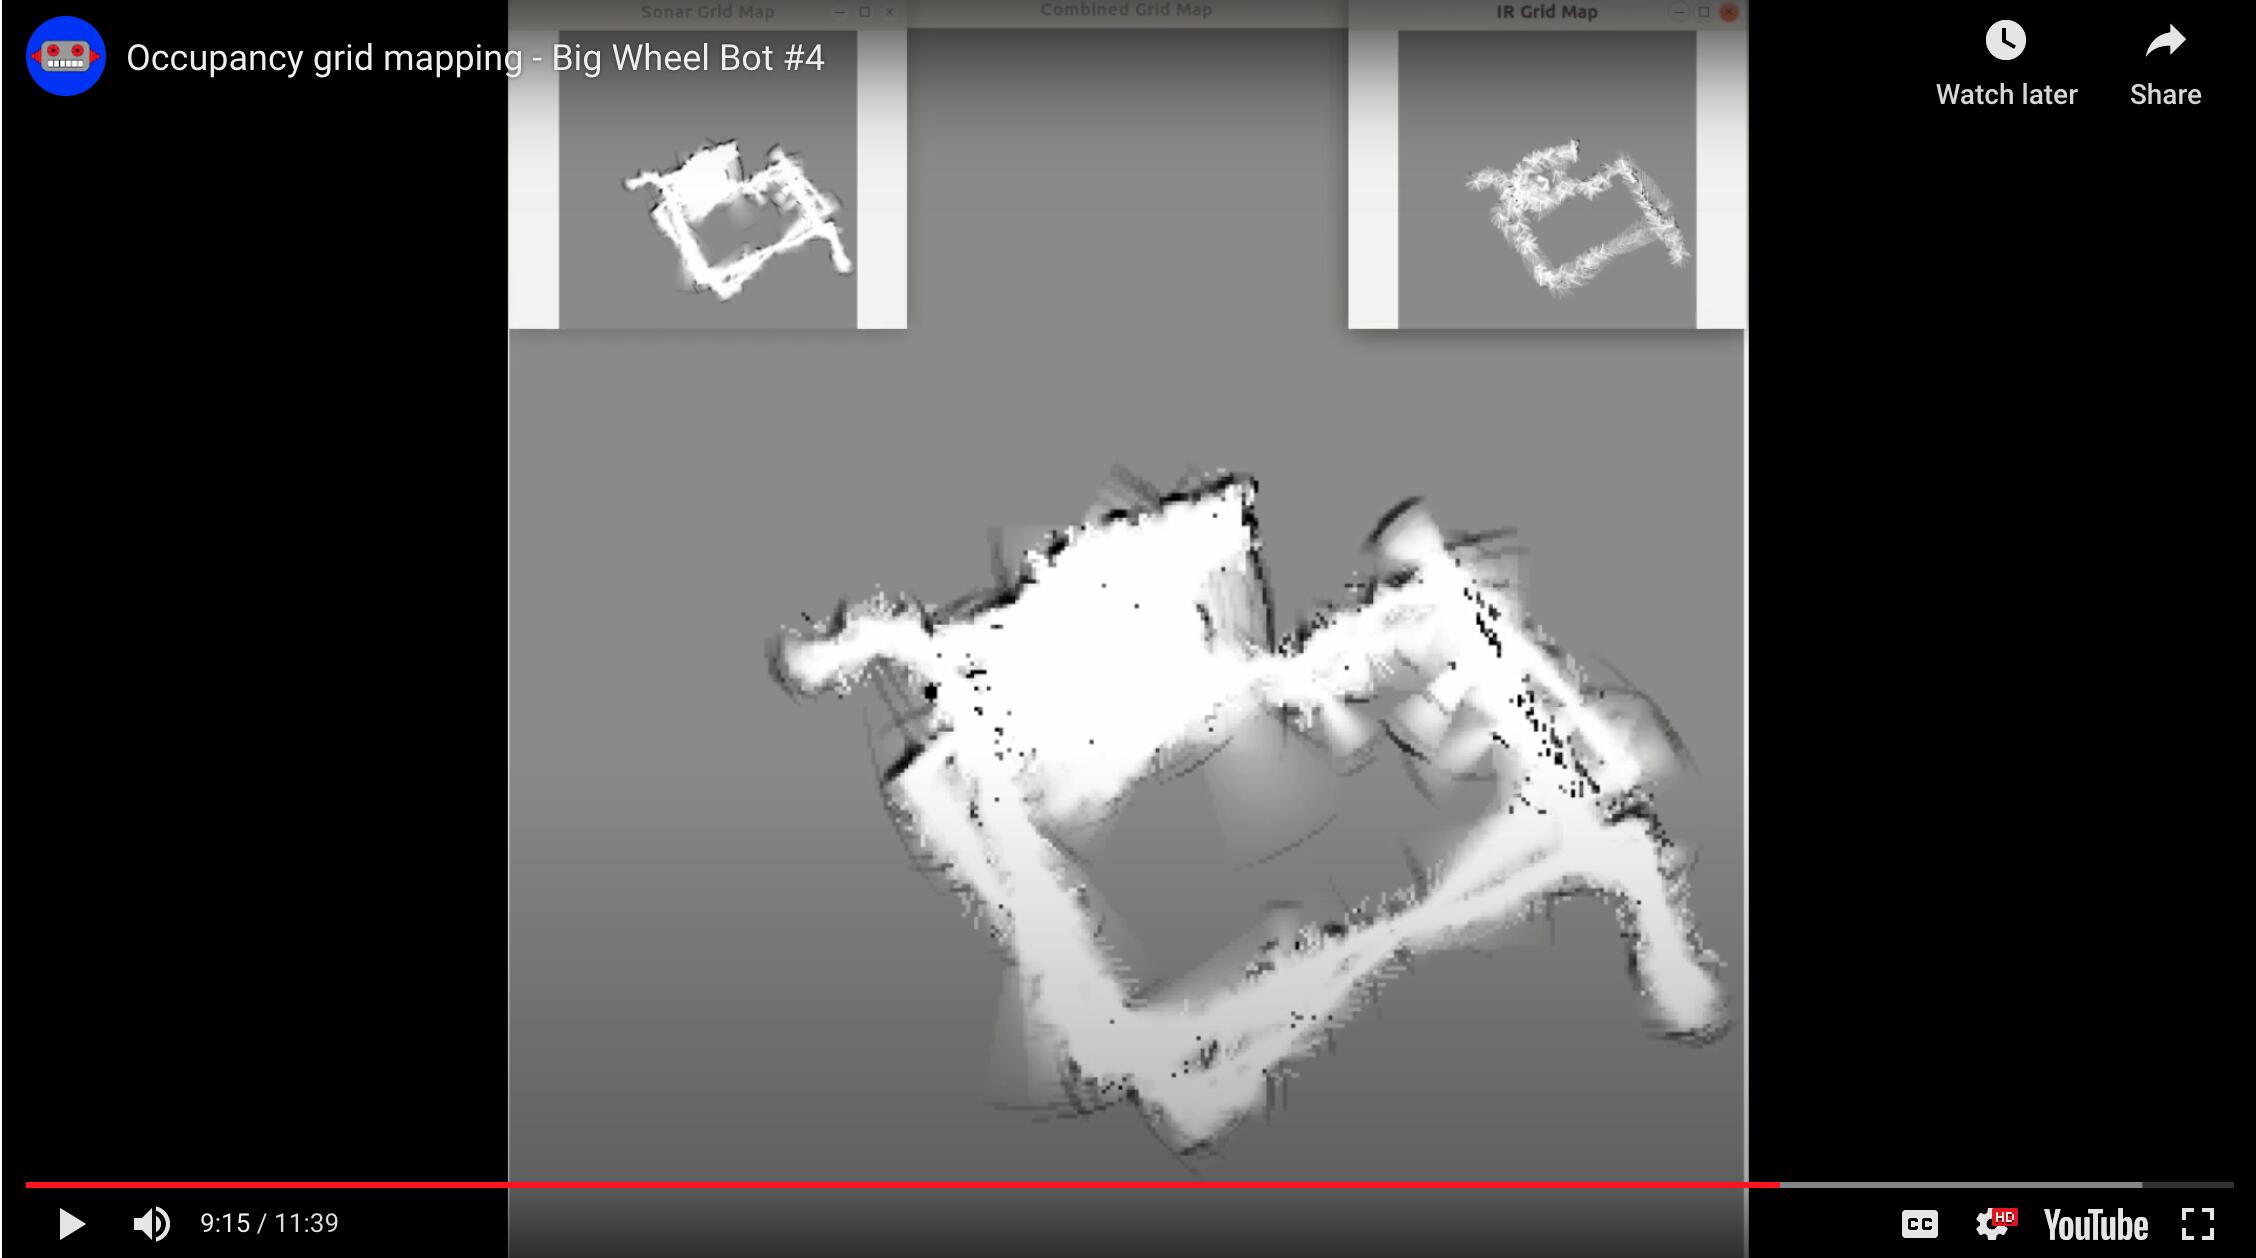
- Occupancy Grid Plotter - Python, OpenCV reads Data.txt and uses sensor probability functions to create the Occupancy Grid in an OpenCV image array.
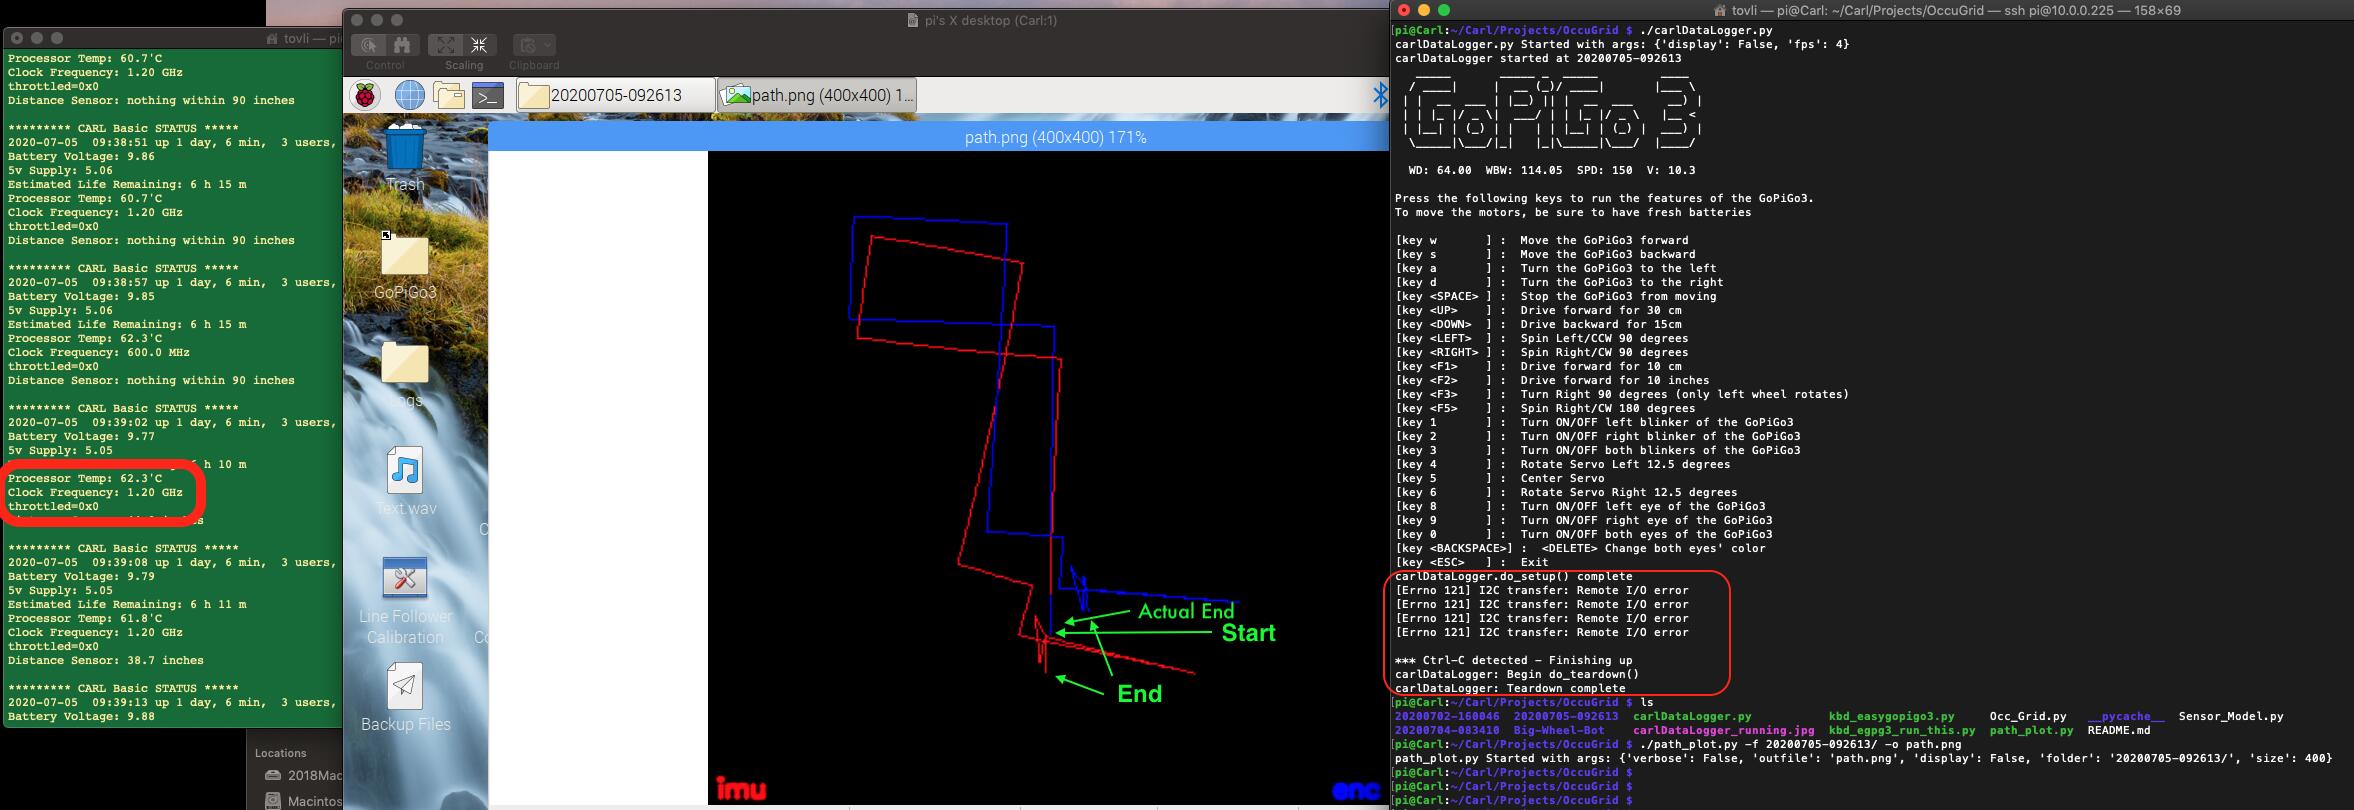
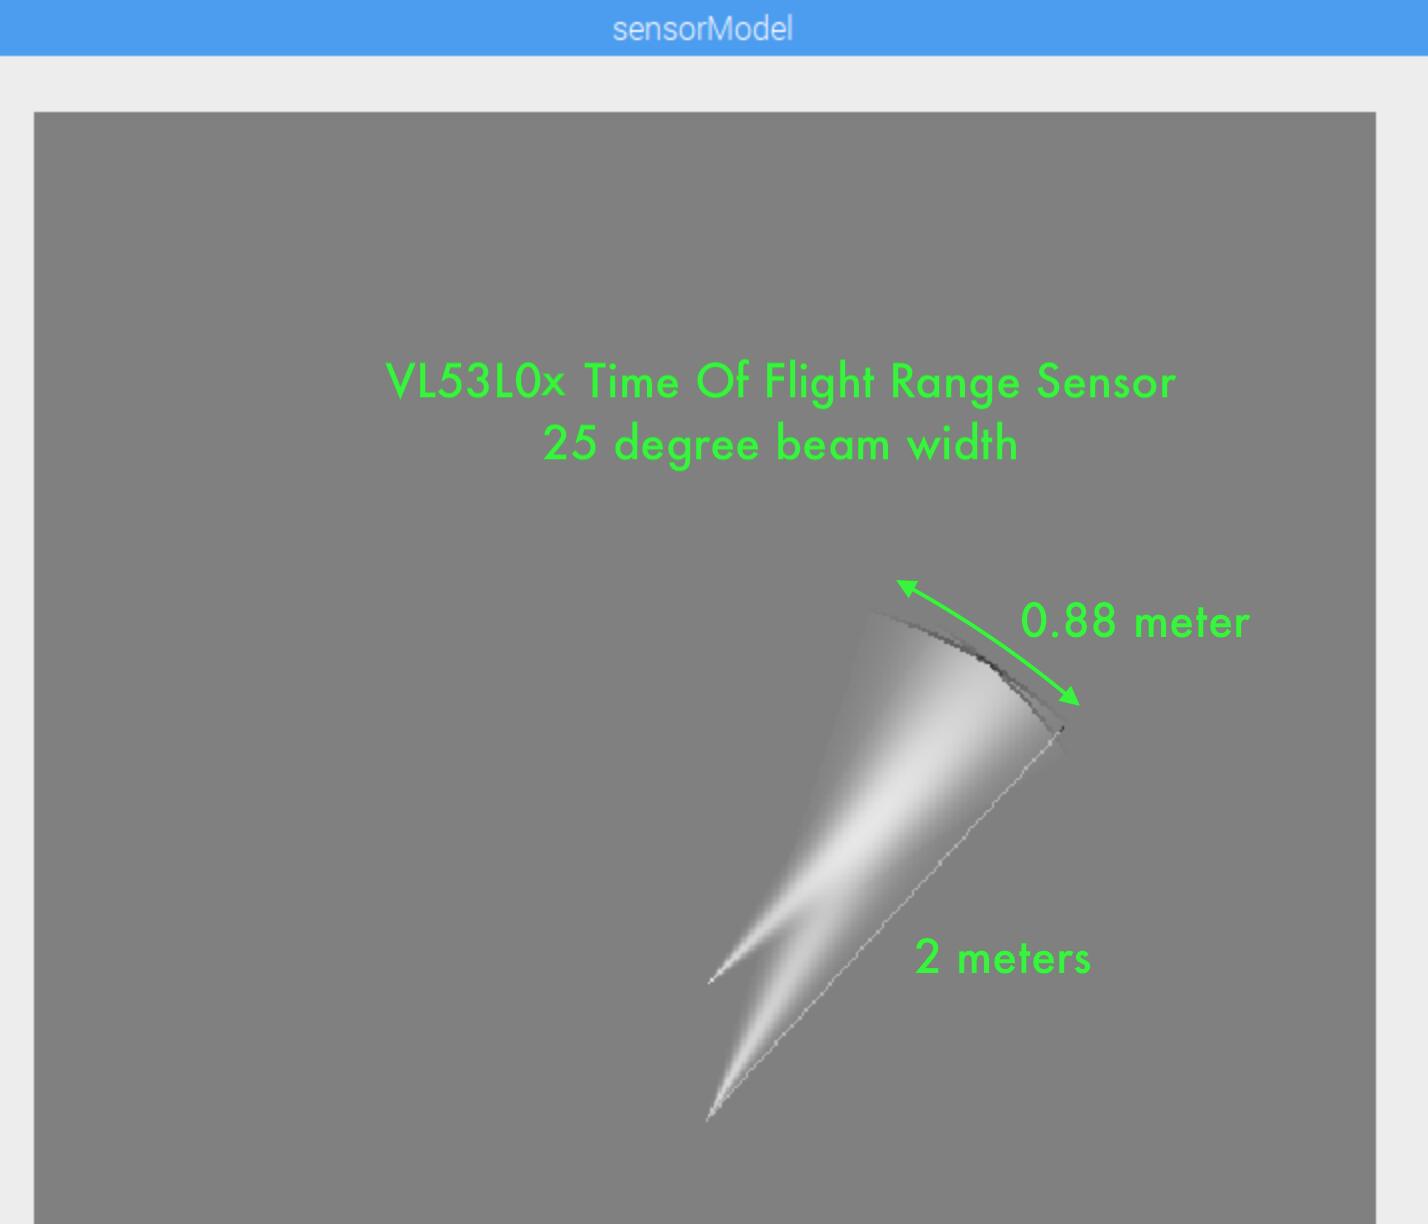
Being crazy obsessed with Carl as I am, I decided this looked like something I could reproduce for my GoPiGo3 robot Carl with his panning DI ToF Distance Sensor, DI IMU, and GoPiGo3 wheel encoders, and his PiCamera.
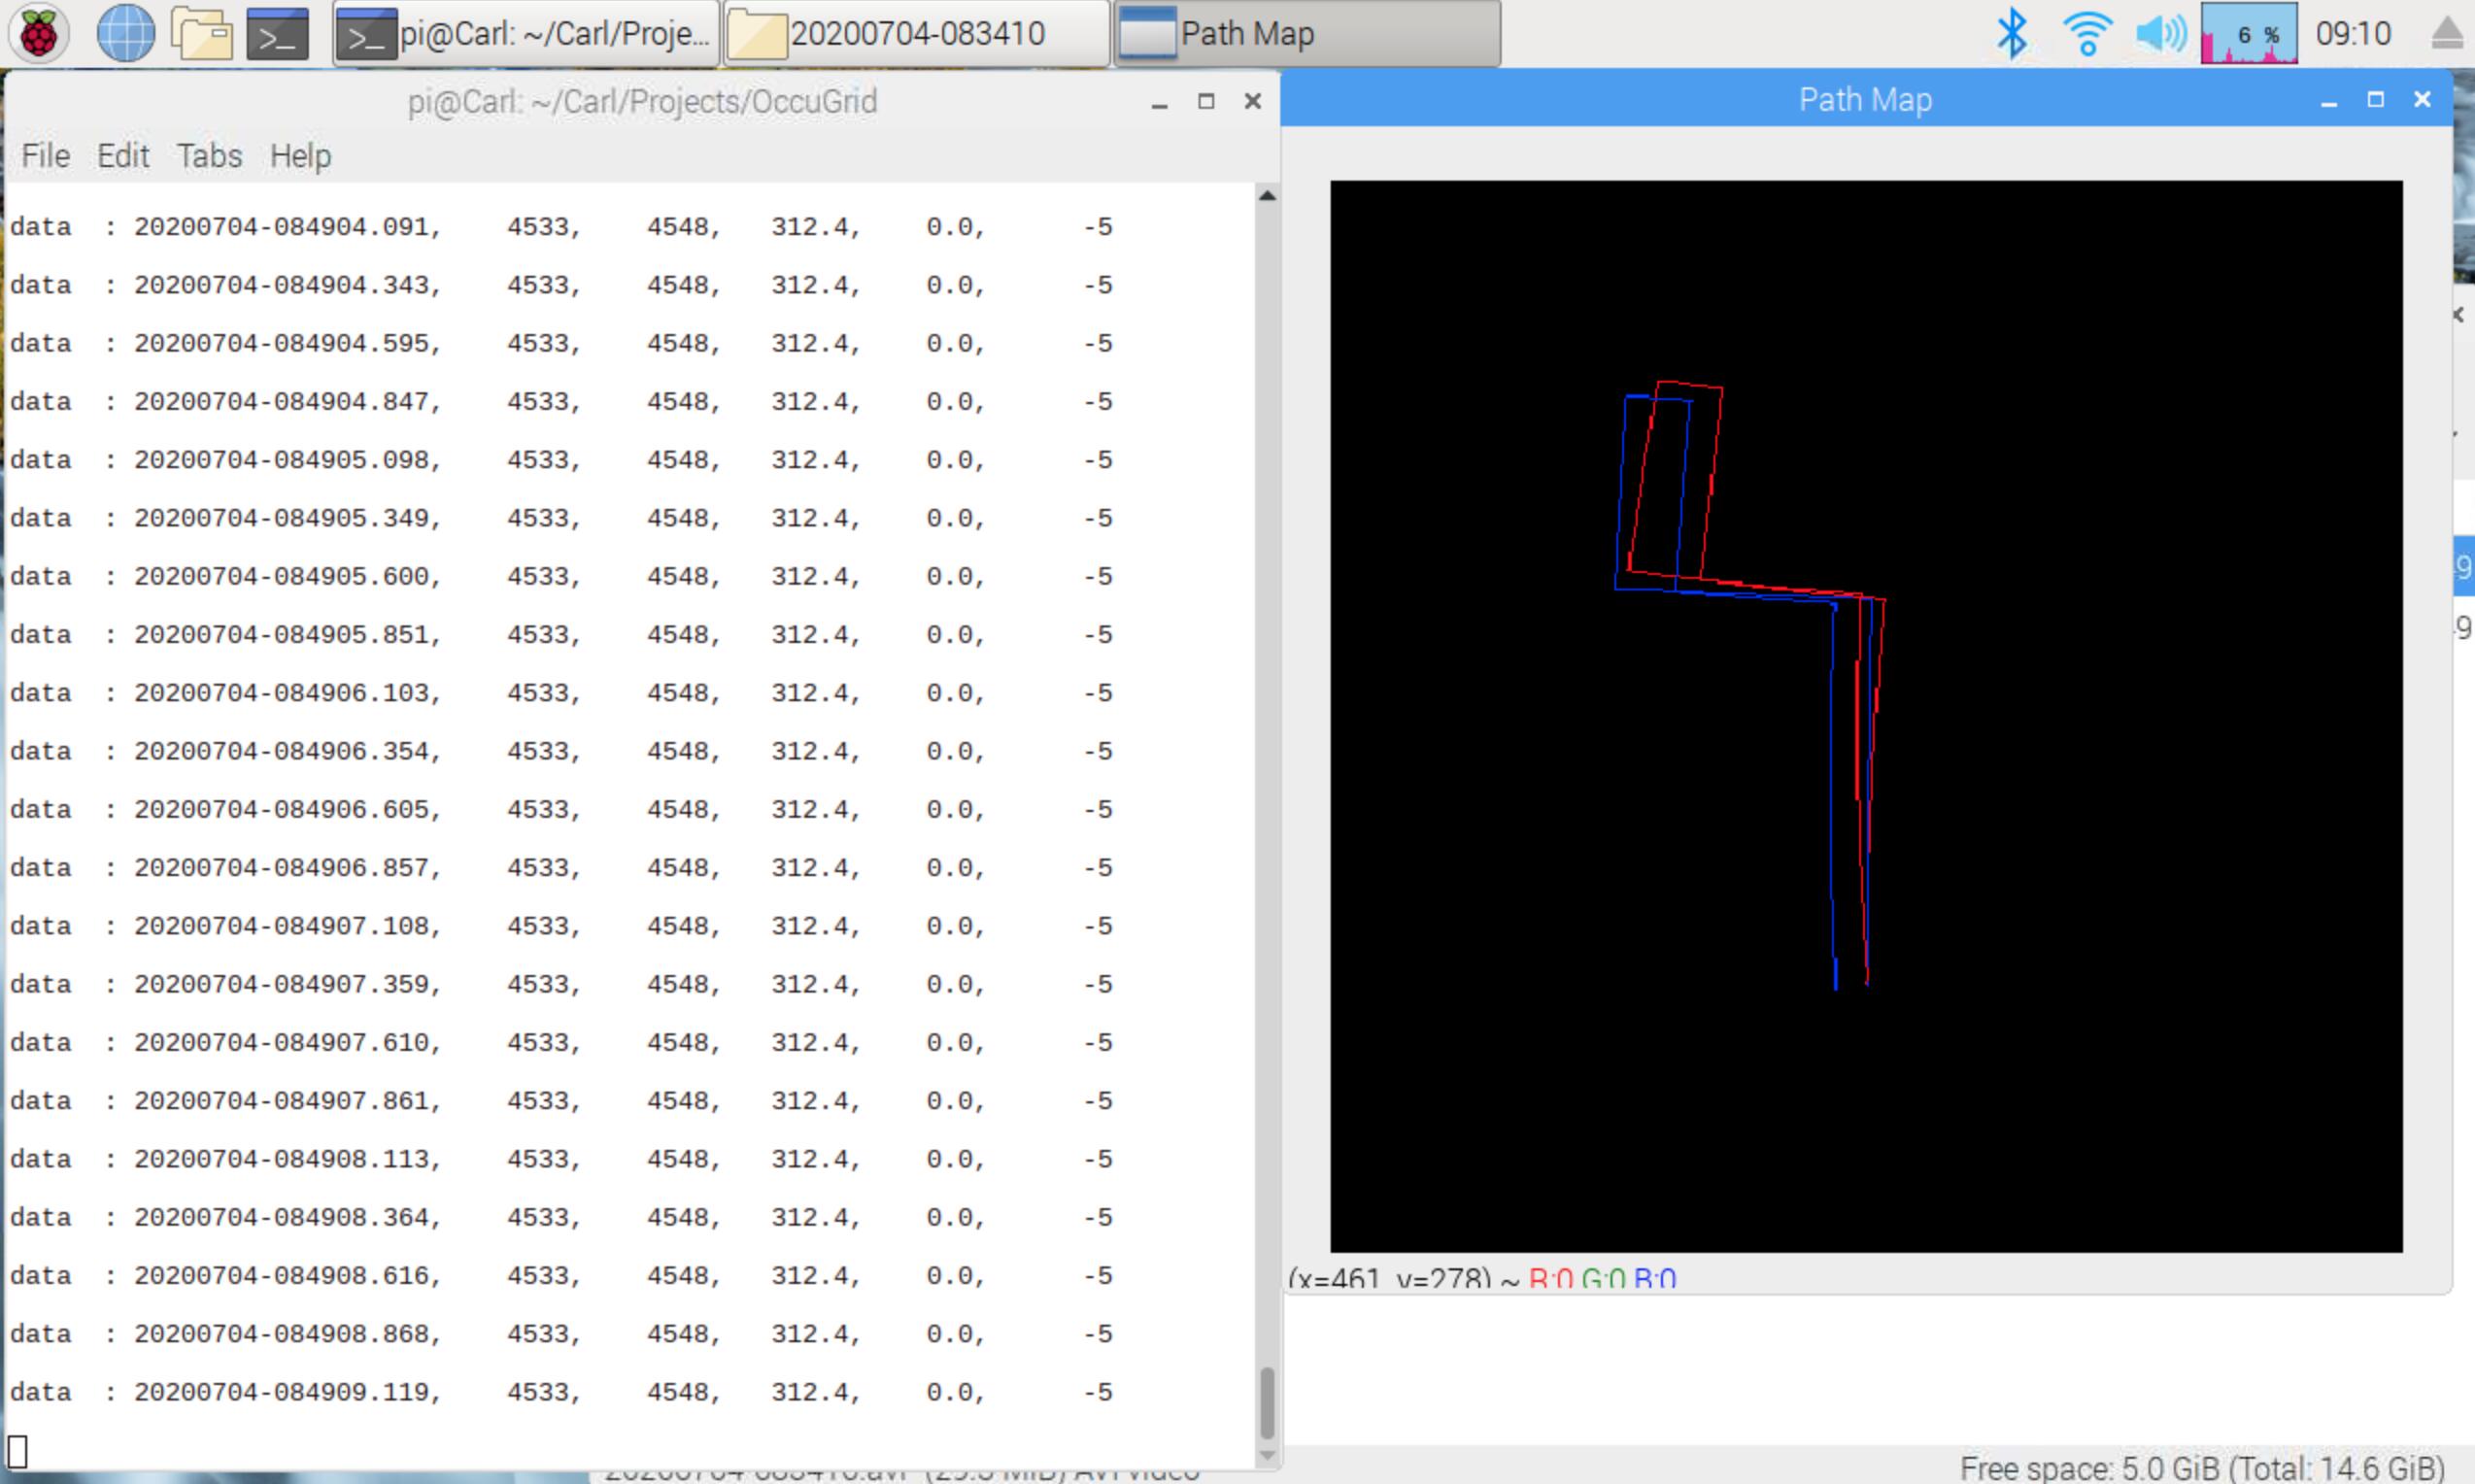
Getting the Data.txt file going was smooth sailing, but that synchronized video was really frustrating me this week. After hours and hours searching the net, trying every possible tweak from the various fragments I found, I thought “this one has beaten me.”
Now, having had a breakthrough by switching image height and image width in one line, I can hardly contain my happiness.
So I finish this week with the data and video gathering program done. Next week the autonomous explorer program and hopefully the path display program.
His path display:
His Occupancy Grid display:
Carl is charging up to be ready to explore: