[SOLVED] DHT sensor occasionally returning spurious values

I’m using a GrovePi on a Raspberry PI 3 running the latest raspbian (Jessie) with python code to measure values from a Temperature and Humidity Sensor Pro (white DHT22 / AM2302 version) every ten seconds and log the readings to a file. The code is based on the dht example, and appears to be working fine. Here is the relevant part of the code:

sensor = 4  # The Sensor goes on digital port 4.
# temp_humidity_sensor_type
blue = 0    # The Blue colored sensor.
white = 1   # The White colored sensor.
f = open ('/home/rsh/dht.csv',mode='a',buffering=1)

while True:
    time.sleep(10)
    try:
        # The first parameter is the port, the second parameter is the type of sensor.
        [temp,humidity] = grovepi.dht(sensor,white)

    except IOError:
        print ("Error")

    if math.isnan(temp) == False and math.isnan(humidity) == False:
        print('{},{:.01f},{:.01f}' .format(strftime("%Y-%m-%d %H:%M:%S"), temp, humidity),file=f)

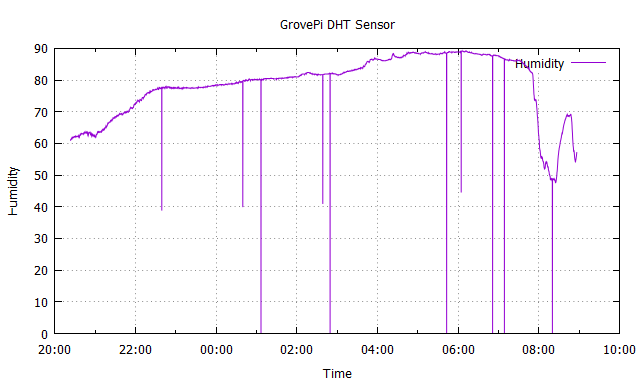
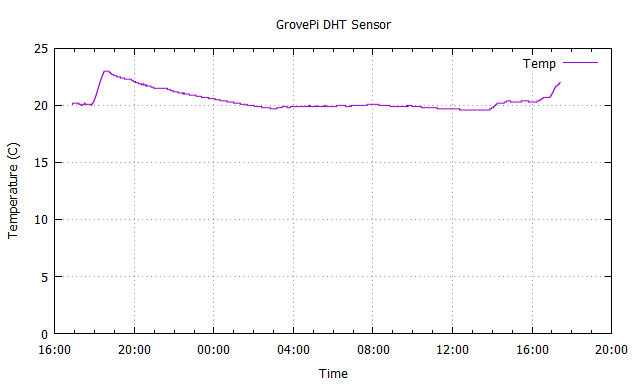
I logged temperature and humidity overnight in a sheltered outdoor location. Here is a gnuplot graph showing temperature against time:

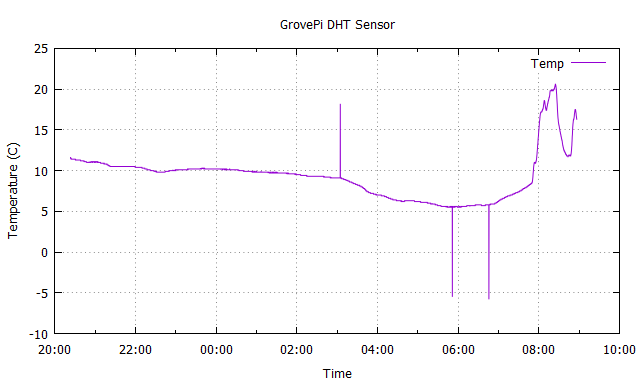
The data is mostly believable, but there are occasional spurious readings: see the occasional anomalous single readings on the graph. Looking at a couple of these in the underlying data:

The high temp value just after 3.00 am. Note that 18.2 is exactly twice 9.1:

2017-04-29 03:04:26,9.1,81.7
2017-04-29 03:04:36,18.2,81.7
2017-04-29 03:04:46,9.1,81.8

The low temp value just before 6.00 am. The absolute value is correct, but the sign is wrong:

2017-04-29 05:51:11,5.6,88.8
2017-04-29 05:51:21,-5.5,88.8
2017-04-29 05:51:31,5.5,88.8

I believe the output from the underlying AM2302 / DHT22 measurement chip includes a checksum, which should catch these sorts of errors. So I wonder if it’s something in the library or perhaps the GrovePi firmware. Or perhaps it’s a faulty sensor?

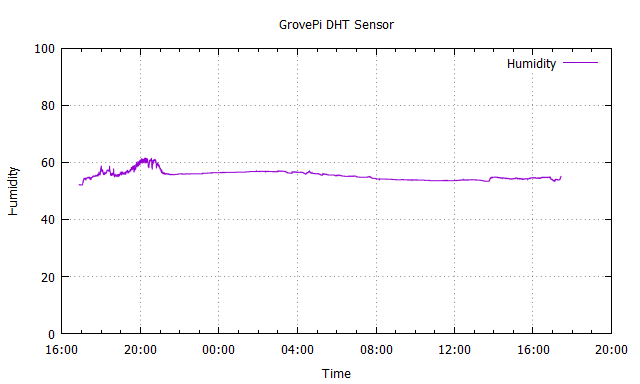
I’m seeing similar issues with the humidity readings as well, but I can’t include the graph as the forum software only lets me post one image. I may include it in a follow-up if it helps.

Has anyone seen anything similar to this? I can try a different language if that would help narrow down the problem.

Possibly noise/interference​?

Hi there,

I have exactly the same problem on two diffferent systems.
In my case the wrong readings are almost always zero values, both for temperature and humidity.
However temperature zero values are occuring much more.
I logged this problem last week under ‘DHT 22 errors - 0 and nan reading’.

No cable or firmware or python issue in my humble opinion, so if you are able to solve it, I would be very glad.

Many thanks,

Freddy

My system is not in an electronically noisy environment, and the lead connecting the DHT to the GrovePi shield is quite short (about 20cm), so I wouldn’t expect much interference. I guess it could be picking up interference from the Pi or its power supply, but I would have expected this to cause the checksum to fail rather than return a spurious reading.

To give some additional information, here is the humidity plot for the same time range as my earlier temperature plot:

Looking at the underlying data:

Here is the low reading around 22:40 pm. 38.8 is exactly half of 77.6:

2017-04-28 22:38:51,9.8,77.6
2017-04-28 22:39:01,9.8,38.8
2017-04-28 22:39:11,9.8,77.6

We can see other examples of readings representing half the true value around 0:40 am, 2:40 am and 6:05 am.

Here is the zero reading around 1:06 am. Note that it shows as -0.0, whatever that means:

2017-04-29 01:06:26,9.8,80.1
2017-04-29 01:06:36,9.8,-0.0
2017-04-29 01:06:46,9.8,80.2

You can see several other zero values in the graph.

I’ve noticed the library code returns NaN (not a number) if the values are out of range. Here’s the relevant line from the dht() function in grovepi.py:

        if t > -100.0 and t <150.0 and hum >= 0.0 and hum<=100.0:
                return [t, hum]
        else:
                return [float('nan'),float('nan')]

My code, which was based on the sample code, was ignoring these errors and just going round the loop again. Looking at the data, I can see a few instances where samples have been missed. For example here we have a 20 second gap between 20:42:40 and 20:43:00 which indicates that the sample at 20:42:50 was missed:

2017-04-28 20:42:30,11.2,63.1
2017-04-28 20:42:40,11.2,63.0
2017-04-28 20:43:00,11.1,63.0
2017-04-28 20:43:10,11.2,63.1
2017-04-28 20:43:20,11.2,63.1

So I suspect I’m getting occasional NaN results returned, which indicate that the value was out of range.

1 Like

Hi royhills,


You can always expect from a sensor module (not just ours, but any sensor on the market) to give erratic values at some point.


Statistically speaking, the likelihood of encountering a bad reading increases exponentially as time passes.

That’s why people have come up with statistical / filtering models. So we can eliminate noise.
Your situation is fundamentally very similar to what engineers have encountered back in the days.
One solution I can think of now is the old Dolby noise-reduction systems (take is as just an example).
There are oh-so-many systems nowadays that use filtering in order to eliminate noise.

Apart from the improvements a system can get regarding the reading accuracy, you must also approach this situation by filtering the data.


I wrote you a python script which does a similar thing - but on a much lower scale.
The python script is composed of 2 processes:

  1. 1 of it does the filtering -> it happens in data_collector thread

  2. the other is for displaying the processed data -> it happens in the main thread

Don’t forget to install numpy though.


Down bellow are the processes described.

data_collector thread (used for filtering data):

  1. read x values for x seconds (where x = 10 seconds)

  2. determine mean value of the newly acquired list (where mean is basically the average)

  3. determine standard normal deviation value (it represents the maximum deviation from the average value of the list)

  4. filter only the values that go under a threshold (threshold is described by std_factor) - it’s computed using the mean & standard normal deviation values

  5. average the data and insert it in the appropriate buffer

  6. repeat

Also, take a look at this probability distribution of a given data set (or population) - it can help you understand.
It can be thought as a function which describes how often an event of a certain value can happen.
By dividing the probability distribution in slices, we can assign probability percentages on each of them - just like in the image below.
You can think of our filtering process as a function which only lets the green slices to pass, while the others are “dropped”.


main thread (used for displaying data):

  1. check if buffer has values -> if so, extract

  2. do whatever you want with them -> your code

  3. repeat


And here’s the code (guard it with your life):

import grovepi
import math
import numpy
import threading
from time import sleep
from datetime import datetime

sensor = 4  # The Sensor goes on digital port 4.
# temp_humidity_sensor_type
blue = 0    # The Blue colored sensor.
white = 1   # The White colored sensor.

filtered_temperature = [] # here we keep the temperature values after removing outliers
filtered_humidity = [] # here we keep the filtered humidity values after removing the outliers

lock = threading.Lock() # we are using locks so we don't have conflicts while accessing the shared variables
event = threading.Event() # we are using an event so we can close the thread as soon as KeyboardInterrupt is raised

# function which eliminates the noise
# by using a statistical model
# we determine the standard normal deviation and we exclude anything that goes beyond a threshold
# think of a probability distribution plot - we remove the extremes
# the greater the std_factor, the more "forgiving" is the algorithm with the extreme values
def eliminateNoise(values, std_factor = 2):
    mean = numpy.mean(values)
    standard_deviation = numpy.std(values)

    if standard_deviation == 0:
        return values

    final_values = [element for element in values if element > mean - std_factor * standard_deviation]
    final_values = [element for element in final_values if element < mean + std_factor * standard_deviation]

    return final_values

# function for processing the data
# filtering, periods of time, yada yada
def readingValues():
    seconds_window = 10 # after this many second we make a record
    values = []

    while not event.is_set():
        counter = 0
        while counter < seconds_window and not event.is_set():
            temp = None
            humidity = None
            try:
                [temp, humidity] = grovepi.dht(sensor, blue)

            except IOError:
                print("we've got IO error")

            if math.isnan(temp) == False and math.isnan(humidity) == False:
                values.append({"temp" : temp, "hum" : humidity})
                counter += 1
            #else:
                #print("we've got NaN")

            sleep(1)

        lock.acquire()
        filtered_temperature.append(numpy.mean(eliminateNoise([x["temp"] for x in values])))
        filtered_humidity.append(numpy.mean(eliminateNoise([x["hum"] for x in values])))
        lock.release()

        values = []

def Main():
    # here we start the thread
    # we use a thread in order to gather/process the data separately from the printing proceess
    data_collector = threading.Thread(target = readingValues)
    data_collector.start()

    while not event.is_set():
        if len(filtered_temperature) > 0: # or we could have used filtered_humidity instead
            lock.acquire()

            # here you can do whatever you want with the variables: print them, file them out, anything
            temperature = filtered_temperature.pop()
            humidity = filtered_humidity.pop()
            print('{},{:.01f},{:.01f}' .format(datetime.now().strftime("%Y-%m-%d %H:%M:%S"), temperature, humidity))

            lock.release()

        # wait a second before the next check
        sleep(1)

    # wait until the thread is finished
    data_collector.join()

if __name__ == "__main__":
    try:
        Main()

    except KeyboardInterrupt:
        event.set()

Let me know if there’s anything else.

Thank you!

5 Likes

Many thanks for the filtering code. It works fine, and has tidied up the sensor readings nicely.

Using the raw values, I was getting around 0.1% bad readings, which mainly consisted of half-readings, zero-readings and double readings (observed, but not posted). After switching to your code, I don’t see any anomalous readings at all.

Here is a 24-hour temperature plot, taken from inside my house. The temperatures look about right (I like it warm); and the increase around 6.00 pm corresponds with when I put the gas fire on followed by the gradual cool-down after I turned it off. In summary, it looks correct, with no anomalous readings:

And here’s the humidity graph. Again, this looks about correct. Interestingly, it seems to indicate the period when the room was occupied, which I hadn’t expected:

I’m not sure if the anomalous readings are totally due to noise, as the doubling/halving errors seem to suggest bit-shifting of the digital reading, and the sensor checksum should be eliminating these. But the behaviour with your supplied filtering code is now good enough for my application, so as far as I’m concerned the problem has been fixed for me.

2 Likes

Hi royhills,

I’m really glad it solved out.
I think we’ll turn this script into an example program, since it did its job really well.

Thank you!

1 Like

Thanks, this code can be applied to mire than just the grovepi. I will probably use this myself. :slight_smile: