Oh yes, I remember attempting a project that used the left-over juice in the battery of a friend’s Poloroid film pack. As the designated “High School Photographer and Videographer” (1969, Film), I was not able to imagine at the time the amazing things folks were doing professionally with large format Poloroid, but I loved tearing the spent film pack apart for the battery.
2 Likes
The problem with knowing a subject thoroughly is that you forget that others may not know it as well as you do.
“It’s obvious to ME !” is a trap that is easy to fall into.
Nice catch and thank you.
2 Likes
Update:
-
I have begun looking at the circuit for the state of charge meter and have noticed some interesting differences between what I expect and what I see.
- The spec for the TI431 reference diode is a VRef of 2.5v.
- My measured value within the breadboarded circuit is 1.8v
-
I have decided that it’s time to move my design efforts firmly into the 20th century.
- Texas Instruments offers a freeware circuit simulation tool based on TINA.
Viz.:
https://training.ti.com/tina-ti-tutorial
- Texas Instruments offers a freeware circuit simulation tool based on TINA.
Using the circuit simulator will allow me to “breadboard” things and see what they should be doing, (at least according to the SPICE models provided by TI), and compare it to what I actually see.
It appears that TINA is the “ROS” of circuit design  and I should get to know it.
More later.
2 Likes
Another update:
I took the time to make a chart of all the input voltages to the comparator from 13.0 all the way down to 8.0 in 0.5v steps.
Result?
Mass confusion. Absolutely nothing is making sense to me.
This tells me that:
-
I am missing something big here or fundamental assumptions are not valid.
-
The schematic I received is not correct.
I am continuing my research, but I am thoroughly confused at this point. Based on the schematic received, ohm’s law, and the known characteristics of the TI431, this circuit should not work at all.
Since I have no doubt about ohm’s law, then the only other options are either the schematic for the State-of-Charge circuit is total B.S., or my information about the TI431 is wrong.
More later.
Update:
I discovered that I’m reading the table backwards!
Reversing the order of the LED’s and reading the table the “other way around” makes a lot of sense and it should be tripping, (LED’s going off), at about 12, 11, 10, and 9v.
IMHO, it should be 12.5, 11.5, 10.5, and 9.5v.
I still need to model the TI431.
2 Likes
Update:
Some technical information for those interested, and an explanation of how I got so confused. Note that once I tabulated all the voltage at each node, (LED), with respect to the input voltage, things became obvious.
Figure 1.
A “typical” LM339 comparator used to measure voltage and light LED’s
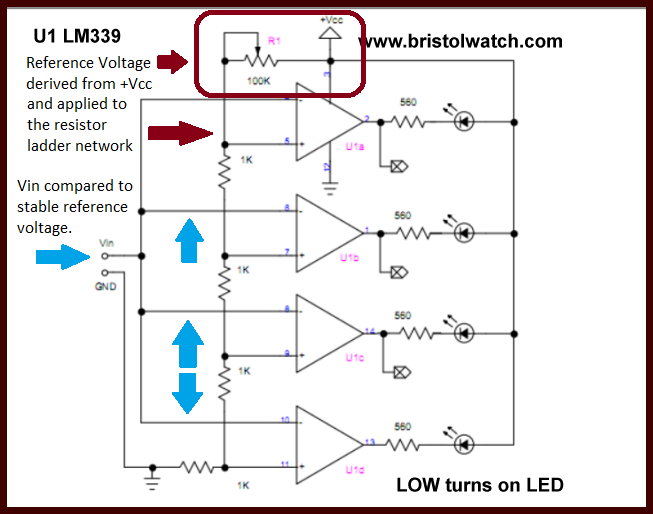
In figure 1, you will notice that the ladder network is part of the reference voltage network. You will also notice that the reference voltage is derived from the stable Vcc source. In essence, Vcc becomes the reference voltage generator and the measured voltage is applied directly to the other input of the comparitors.
Figure 2.
The “State of Charge” meter in the TalentCell battery.
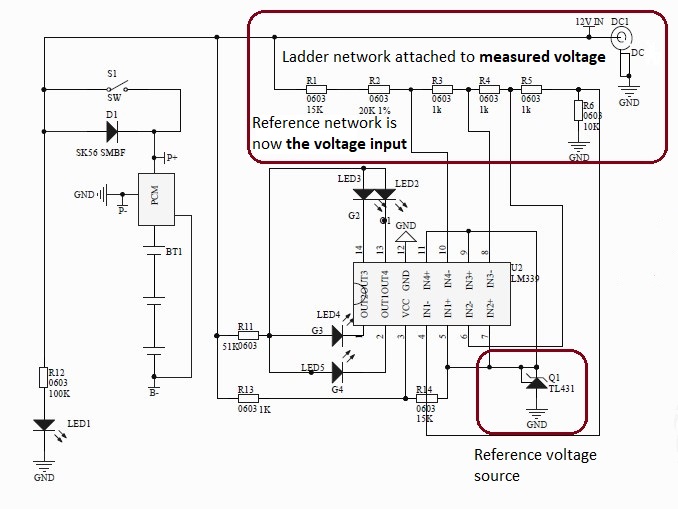
In figure 2, you will notice that the Vcc source is not stable, but is actually the battery voltage we want to monitor. As a consequence it is difficult to derive the stable reference voltage from the measured voltage directly - and apply to the resistor ladder network.
What this circuit does is to “invert” the logic used in figure 1 above.
The TL431 (is supposed to) generates a stable reference voltage of about 2.5v and the voltage divider network is designed that each node, from left to right, is one volt lower that the one above it and is greater than 2.5 volts.
What happens:
- Fully charged, the battery is at about 12.5 volts.
- As the battery is consumed, the voltage drops and the voltage at each node drops proportionally.
- At about 12v, the voltage at the right-most node, (next to the 10k resistor), becomes less than 2.5v and the first LED flips off.
- As the battery voltage drops, each node crosses 2.5v in turn, in one volt increments of the battery voltage, causing each succeeding LED to turn off, with the last LED programmed to extinguish at about 9v.
This is actually a clever way of applying the LM339 to measure a varying voltage where Vcc is not stable.
Since this is not what happens, there are three possibilities:
- The tolerances of the resistors in the ladder network is too great.
- The reference source isn’t set correctly or the change in current through the reference diode as the battery voltage changes causes the reference voltage to change.
- The flip-points vary as Vcc on the device changes.
More when I know more.
2 Likes
Update!
The home stretch.
In the posting above, figure 2 is the State-of-Charge meter. In the top circle note resistors R1 and R2, the scaling resistors for the divider network.
Right now, they are a total of 35k (15k + 20k).
That value is too small and should be 36k at 1% tolerance.
At 36k, the values will be more closely centered.
I will do a hardware study tomorrow, but the calculations are looking really good.
2 Likes
One other thing to investigate:
The actual discharge curve of the battery pack.
You charted that awhile back didn’t you? Do you still have that data?
1 Like
I did not use my battery life logger yet because Dave’s load has not settled yet.
These are specific points measured in the processor only configuration:
- GoPiGo3 + RPi3B+ only:
- 0:05 Battery 11.91v 235mA GoPiGo3 11.26v  = 0.65v protect diode drop
- 1:09 Battery 11.55v 243mA GoPiGo3 10.9v
- 2:00 Battery 11.28v 250mA GoPiGo3 10.59v
- 3:00 Battery 11.02v 256mA GoPiGo3 10.56v
- 4:24 Battery 10.74v 259mA GoPiGo3 10.05v
- 5:20 Battery 10.65v 261mA  GoPiGo3   9.91v
- 7:28 Battery 10.35v 266mA  GoPiGo3  9.63v
- 8:39 safety shutdown at GoPiGo3 9.12v (battery 9.77v)
- Meter 2307mAh 24878mWh = 266mA average at 10.78v average at 2.87W average ??
And another test only the last data points:
- tillShutdownLIfe.py with LIDAR not spinning, GoPiGo3 just standing, RPi3B+ load 0.04
(LIDAR powered but not spinning)- battery protection circuit shut off at 5:57:30 8.28 Battery 7.47v GoPiGo3 reading
- “Too Low” 9.12v Battery 8.31v GoPiGo3 reading 5:55:40 (~2 min reserve)
- “Nearing Shutdown” 9.72v battery 8.91v GoPiGo3 reading 5:43 (~14 min reserve)
2 Likes
Thanks, but that’s not enough data to establish a rate of discharge and, more importantly, where the “drop-off” curve begins as I suspect that it’s somewhere between 9.5 and 9 volts based on readings I’m getting.
What I really need to do is thoroughly characterize the three battery packs I have using a 1 amp and 1/2 amp load, from full charge to the charge controller’s cut-off point. I’d start at fully charged and take voltage readings at about one per minute. Current readings would be great too, but if I can get voltage readings, that would be great.
I’d like to do this three or four times for each characteristic curve and average the points, then compare the three batteries and find out what the maximum delta is.
The problem is that I don’t have the instrumentation to take accurate voltage readings. I don’t think I could use the robot itself since the robot disturbs the readings and once the battery dies, the robot stops running. With the readings file open for write at death-time, I fear it will be corrupted. I’d plug the Pi itself into ground power, but that causes the battery readings to go haywire.
@cyclicalobsessive, may I have the code you use to track the voltage?
Does anyone out there in television land have any ideas on how to instrument this without spending a week writing Arduino code to measure voltage?
Asking @cleoqc to take a peek, just in case she knows something.
2 Likes
Update:
The following is the text of an e-mail I sent to TalentCell:
As I mentioned above, I’d really like to see the discharge characteristic of the cells, and the charge controller’s circuit before I open my big mouth.
One thing I HAVE determined is that the resistor values in the ladder network, (R1 - R6), are extremely critical and should be no greater than 1% parts.
The two possibilities I am currently exploring are:
- The scaling resistors, (R1 and R2), are not correct and they can be replaced with one standard value that will more accurately center the readings. (I prefer to use a minimum of parts as that prevents tolerances from accumulating too excessively.)
- The resistors themselves are not precision resistors and the error in value causes the trip points for the LED’s to be considerably offset. I determined mathematically that an error of 5% in only the scaling resistors themselves, (ignoring the rest), is enough to place the trip-points for the LED’s way out of spec at either end. And a 5% delta is less than 2,000 ohms - a trivial value when you consider that the entire ladder network is 35k, (and is too small).
As I noted above, I have asked TalentCell for information about the tolerances of the resistors used. (My meter says they’re NOT precision resistors!)
Another thing I noticed:
The datasheet for the Texas Instruments LM-339, (they use a TI part), specifies a decoupling capacitor between the Vcc pin, (3), and circuit ground. This decoupling capacitor is needed to stabilize the operating point of the IC and filter out any noise coming from either the charge controller or back from the attached device.
Viz.:

They specify a 0.1μF decoupling capacitor from pin 3 to ground, which is not present. In what is an amazing stroke of luck, the trace for pin 3 is immediately adjacent to a circuit ground island on the PCB so adding the component is a trivial modification.
I am waiting for more information from TalentCell, but I believe I have this issue cracked wide-open now, and it’s just a matter of time.
P.S.
Hopefully, I can get precision resistors so I can make test modifications to my own batteries!
2 Likes
(No “Carl” dependancy - straight GoPiGo3 code)
This is the program that will record “GoPiGo3 measured voltages” to csv file:
wget https://raw.githubusercontent.com/slowrunner/Carl/master/Projects/LogValueAndPlot/logBattV.py

or for code with DIODE_DROP (edit your value in):

wget https://raw.githubusercontent.com/slowrunner/rosbot-on-gopigo3/main/systests/battery/logBattV.py
This is the program that will make the pretty plots:
wget https://raw.githubusercontent.com/slowrunner/rosbot-on-gopigo3/main/systests/battery/plotBattLife.py
Log Value And Print
GoPiGo3 project to monitor battery voltage, and generate plot a “life”
Example :
Introduction:
-
To run:
python(3) logBattV.py
./logBattV.py
./logBattV.py > logBattV.out 2>&1 &./plotBattLife.py battV/csv/battV-YYYYMMDD-HHMM.csv
-
logBattV.py: Checks battery voltage periodically, and writes value to csv file
-
plotBattLife.py: Creates a graphic of voltage vs up time in battLife--.png
-
.csv files are written to <base_folder>/battV/csv/ (created if not existing)
-
.png plot files are written to <base_folder>/battV/pic/ (created if not existing)
Hardware for the plots above:
- Raspberry Pi 3 running with Raspbian.
- DexterIndustries GoPiGo3
- 8 EBL 2800mAh NiMH AA-cells
Installation:
- If desire output in a specific place, set base_dir variable: ./ is the default
Packages needed to be installed for plotting:
-matplotlib (sudo pip install matplotlib)
-plotly
BTW:
The log file is only open when adding a reading line every 6 seconds, and even if the power gets jerked right then, the file will be fine - just a few “@@@@” at the end can be removed the next boot.
And the easiest way to view the plot is to git add/commit/push the png file up and view it on github.
2 Likes
I’m just double checked the code on Dave (has the MR Li-Ion batt), and shutdown to charge the batt.
When it is full, I’ll do a run on Dave with the LIDAR in standby - that pulls 420mA at the start (~5W) and should be around 560mA at the end.
I’ll throw the csv+plot your way tomorrow.
(The light just turned green, but the battery only shows 12.3v so I’m going to keep charging till I see 12.5v)
BTW, you mentioned half and one amp, but the idle GoPiGo3 (RPi 3B+) only draws around a quarter amp, and that will make each test drain go about 9 hours!
Arrgh - forgot to disable the 9.75v safetyShutdown health monitor:

That early dip is me installing matplotlib and plotly.
wget https://raw.githubusercontent.com/slowrunner/rosbot-on-gopigo3/main/systests/battery/battV/csv/battV-20210727-2155.csv
That run was 2618mAh in 5.4 hours = 485mA average load
Charging up for another test…
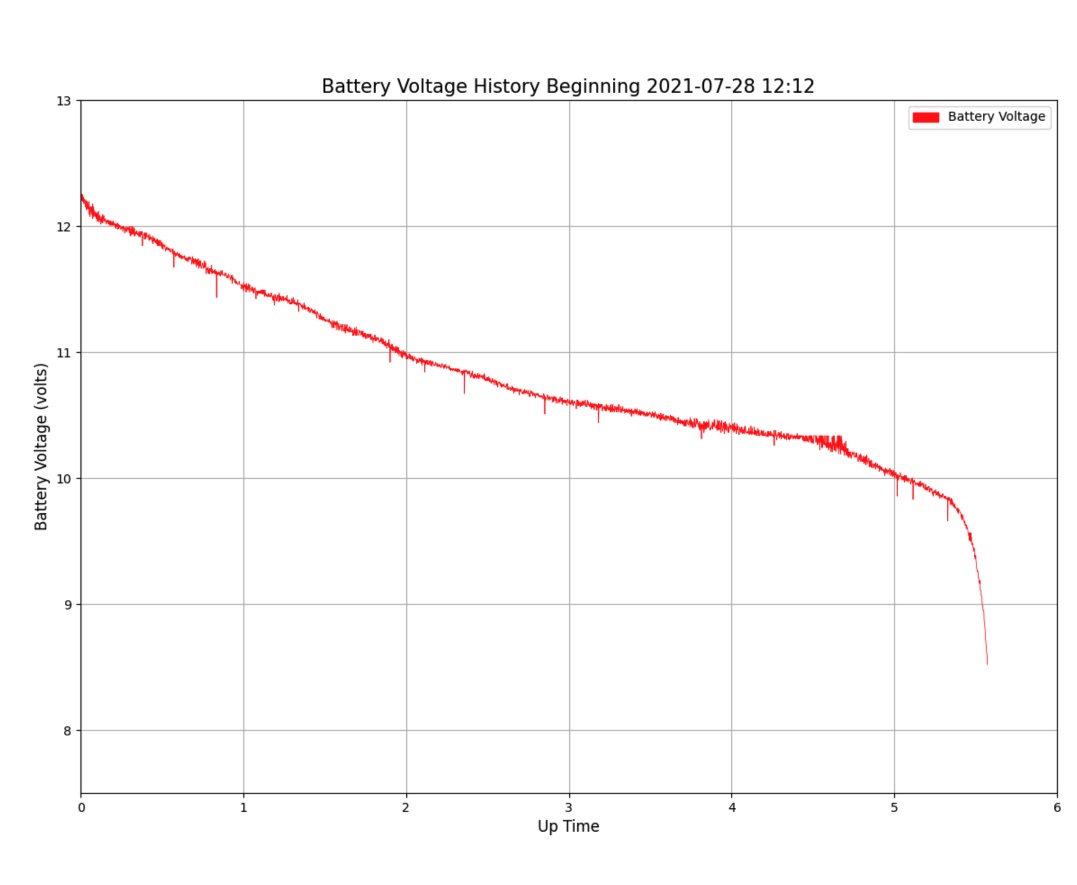
Latest Run:
Full Charge 12.5v (open circuit) to
Battery Protection Circuit Shutoff at 8.5v (under load)
To pull it local:
wget https://raw.githubusercontent.com/slowrunner/rosbot-on-gopigo3/main/systests/battery/battV/csv/battV-20210728-1212.csv
This run was 2599mAh in 5.6 hours = 460mA average load
P.S. The csv had “@@@@@@@@” at the end, and was missing the last two readings that were printed to the console:
logBattV:  17:46:17  8.588
logBattV:  17:46:23  8.519
so, I cleaned up the csv and added the last two readings.
2 Likes
You could also put a 3:1 voltage divider in front of AD1 on Charlie, connect that across a 2nd battery connected to a constant current load? calibrate the voltage seen/reading at AD1 against your voltmeter, then modify the logBattV.py to read/log the battery_from_AD1_voltage instead of Charlie’s battery voltage.
That would always catch the shutdown with no risk to the SD card or file corruption - You could even run Charlie on the wall supply with that setup. If Charlie has a speaker and TTS, he could announce when the shutdown occurred (vBatt_from_AD1 = 0).
Can Charlie talk? If not I am accusing you of stifling robot free-speech rights. “FREE CHARLIE!” Robot voices need to be heard!
2 Likes
Thank you!
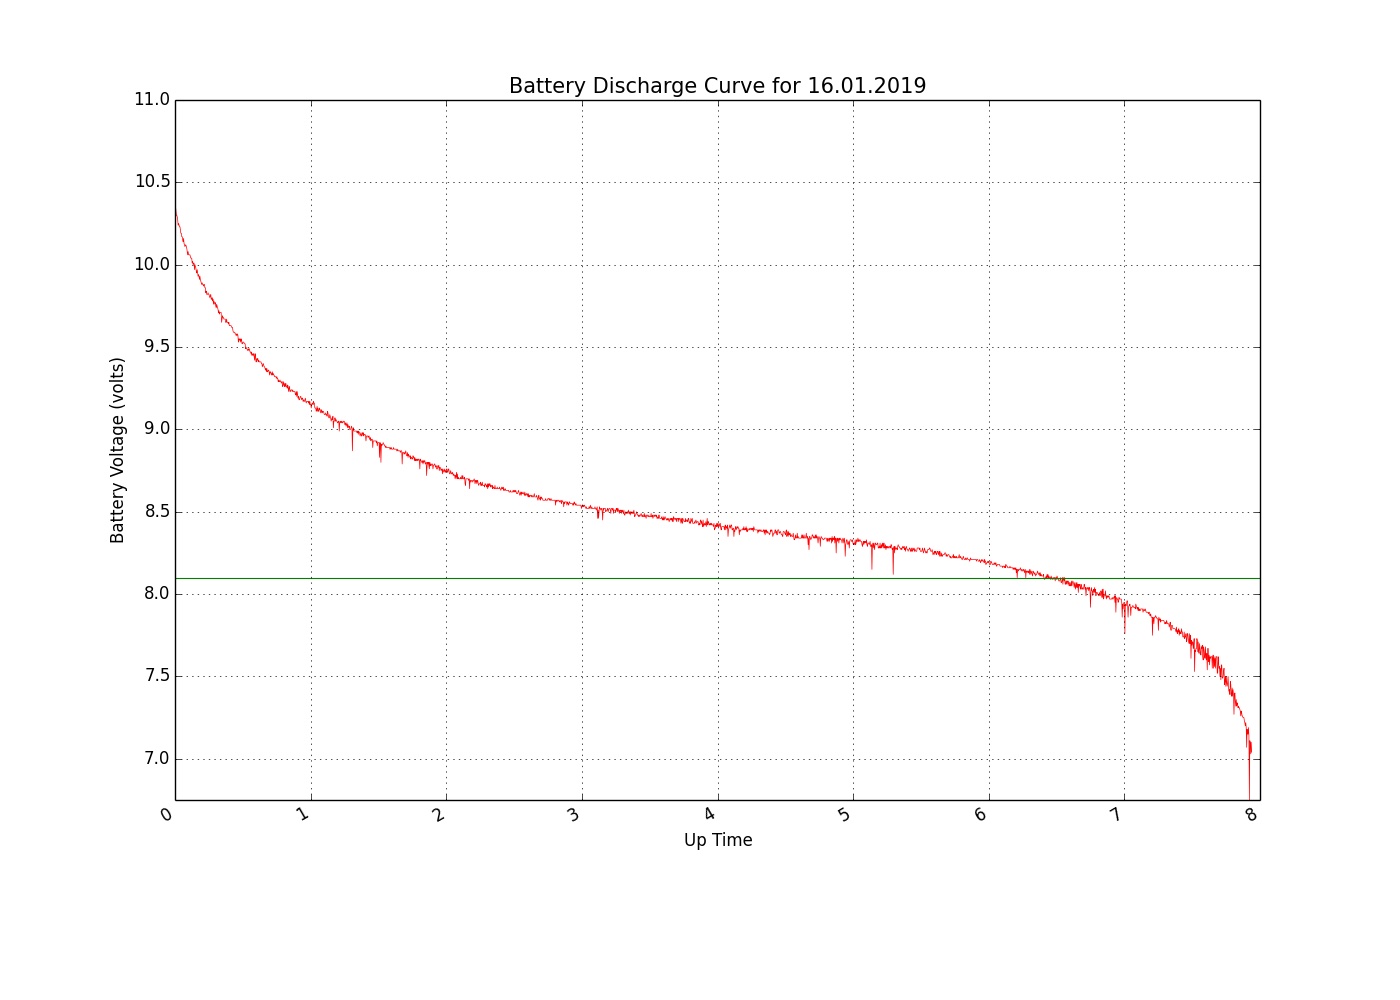
This confirmed what I had suspected all along, that the tail end, Vbatt drops off rapidly in the last quarter of the voltage range.
This may require a change in the ladder network to make it visually linear.
“Sorry Charlie!”
Adding sound to Charlie is a very low priority right now as there are too many things on his plate as it is.
There is the continuing battery meter project, along with a proposal to prototype an adapter for the GiggleBot that will allow a Pi-Zero-W to connect to it - and it’s chewy!
Charlie is still front-and-center on my list, I just need to get a few other things, (like building a bench supply), out of the way to make room for him.
Until I have the spare cycles, and find a suitable speaker, sound is on the “it would be nice if” list.
Call me facist if you wish, , but that’s the way it is.
1 Like
According to this, the final LED should extinguish at 10v, giving a two volt delta from charge to discharge - making the deltaled 0.4v for five visually linear sections.
Grrr!
2 Likes
When you get a “round 2-it” remember Monk Makes Speaker Kit - There is one for the Micro:bit and one for Raspberry Pi, made in England. I like it for three reasons:
- quiet, no electrical noise
- low power
- fits perfectly under GoPiGo3

2 Likes
Whatever I get, it has to be local. Shipping to Russia is a pain even in the best political situation.
2 Likes
?? the final LED ?? Is that the final voltage controlled LED, leaving only a power-on LED ?
2 Likes
Yes.
There are only four LEDs in the comparitor stack.
If I were going to re-design the board, I’d add a couple of transistors, a couple of bias resistors, and make the last LED a red/green pair so that the last active LED flipping would turn the “power” LED red.
Unfortunately that’s not likely to happen.
2 Likes
If they are all the same, won’t you end up with the same behavior as the current product?
It appears there is a significant slope change around 10.75 volts.
Also while the open circuit battery starts between 12.3 and 12.5 volts, it drops to 12.2 in the first minute under load, which would short change the first LED if it is lit from 12.5 to 12.1v.
2 Likes